Open Access
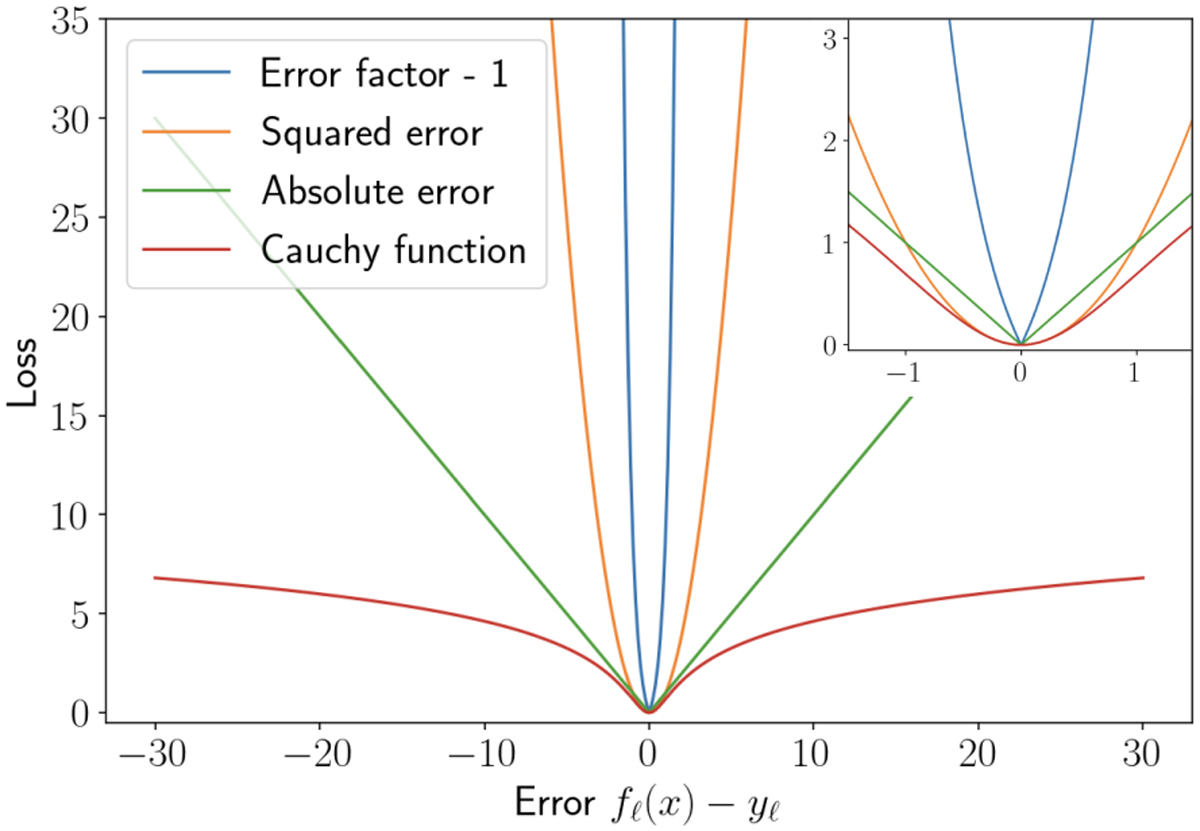
Fig. 3
Download original image
Graph of different loss functions. As with the line intensities, errors are in decimal log scale. An error of 30 thus corresponds to a factor of 1030 between predicted and true intensities. Since some line intensities range from 10−50 to 10—2, this kind of very high error can occur, especially early in the training phase.
Current usage metrics show cumulative count of Article Views (full-text article views including HTML views, PDF and ePub downloads, according to the available data) and Abstracts Views on Vision4Press platform.
Data correspond to usage on the plateform after 2015. The current usage metrics is available 48-96 hours after online publication and is updated daily on week days.
Initial download of the metrics may take a while.