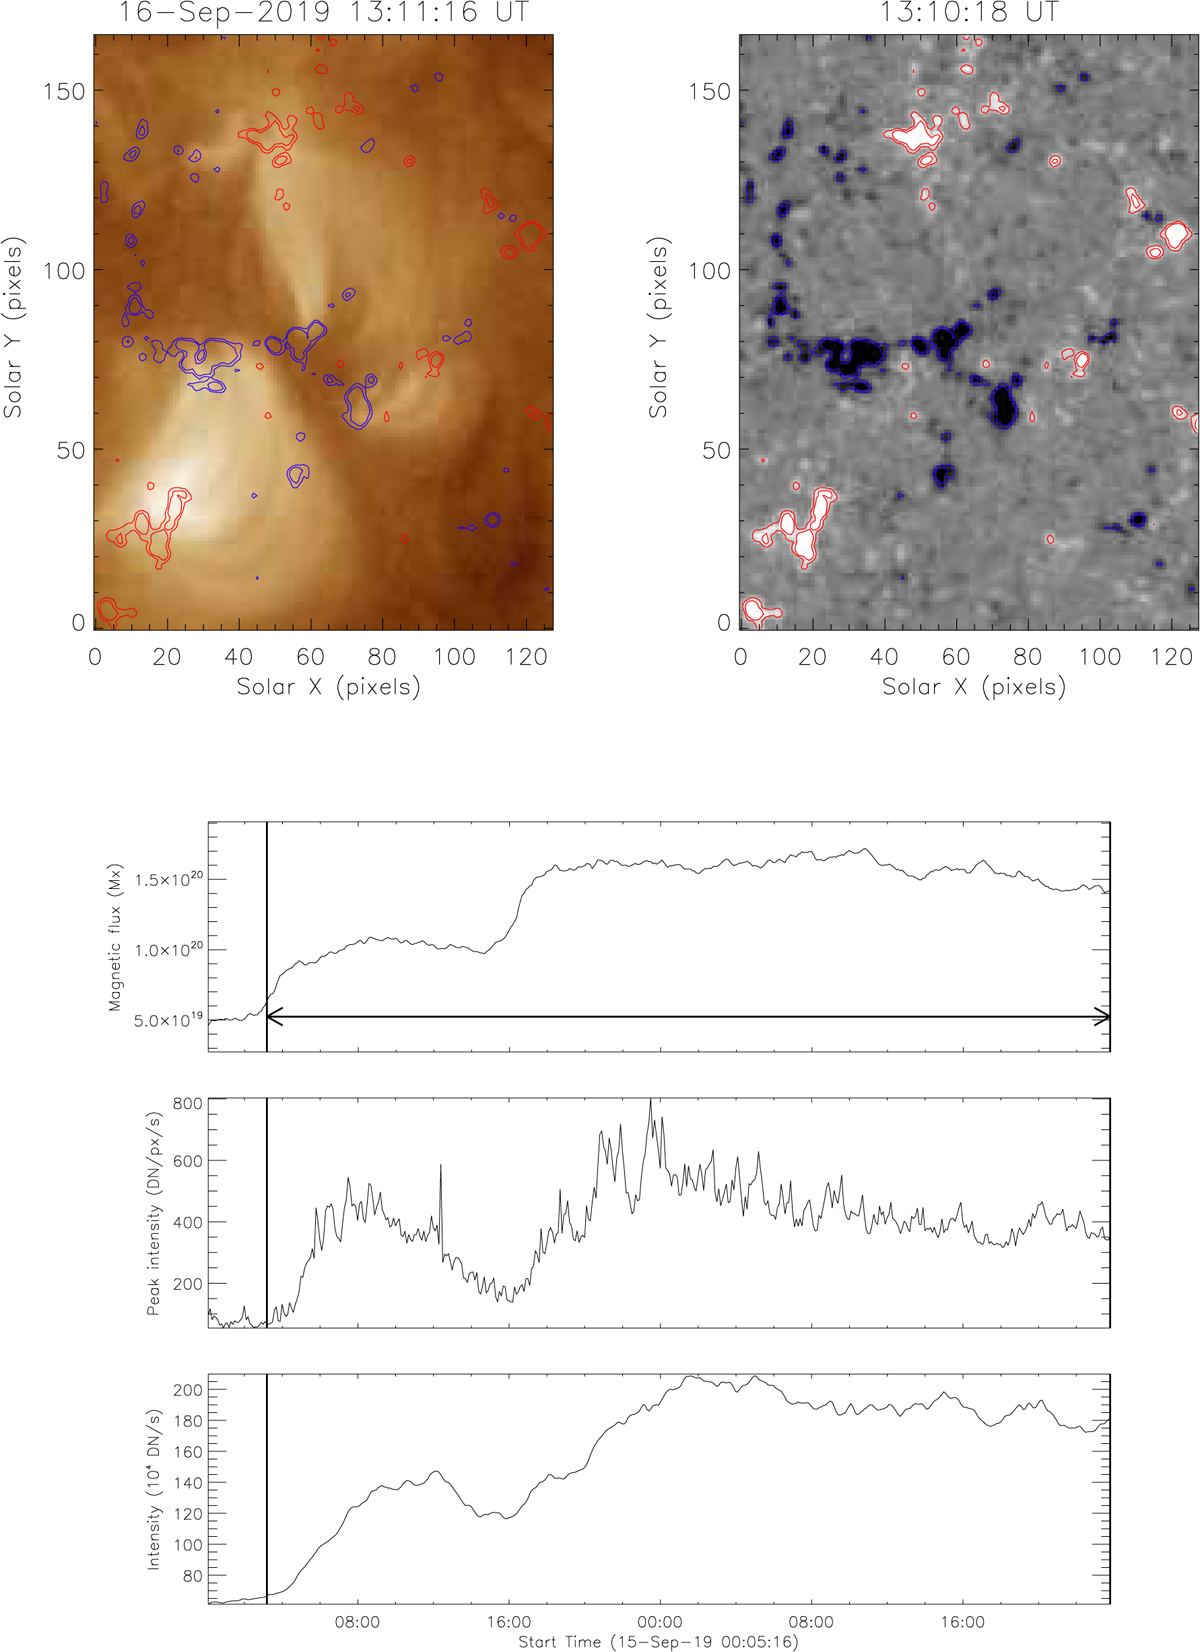
Fig. 3.
Download original image
Intensity and photospheric magnetic flux properties of an SSLS associated with a flux emergence. The top row shows the AIA 193 image and quasi-temporal HMI magnetogram for case 24 (see the online animation bp024.mov). The contours outline the ±25 and ±50 G magnetic flux concentrations. The evolution of the total magnetic flux is shown in the second row, and the maximum (peak) intensity and the total intensity flux evolution taken from the selected FOV are given in the third and fourth rows of Table 1. The two vertical thick lines together with the arrowed horizontal line (only shown in the top panel) indicate the SSLS lifetime.
Current usage metrics show cumulative count of Article Views (full-text article views including HTML views, PDF and ePub downloads, according to the available data) and Abstracts Views on Vision4Press platform.
Data correspond to usage on the plateform after 2015. The current usage metrics is available 48-96 hours after online publication and is updated daily on week days.
Initial download of the metrics may take a while.