Fig. 14.
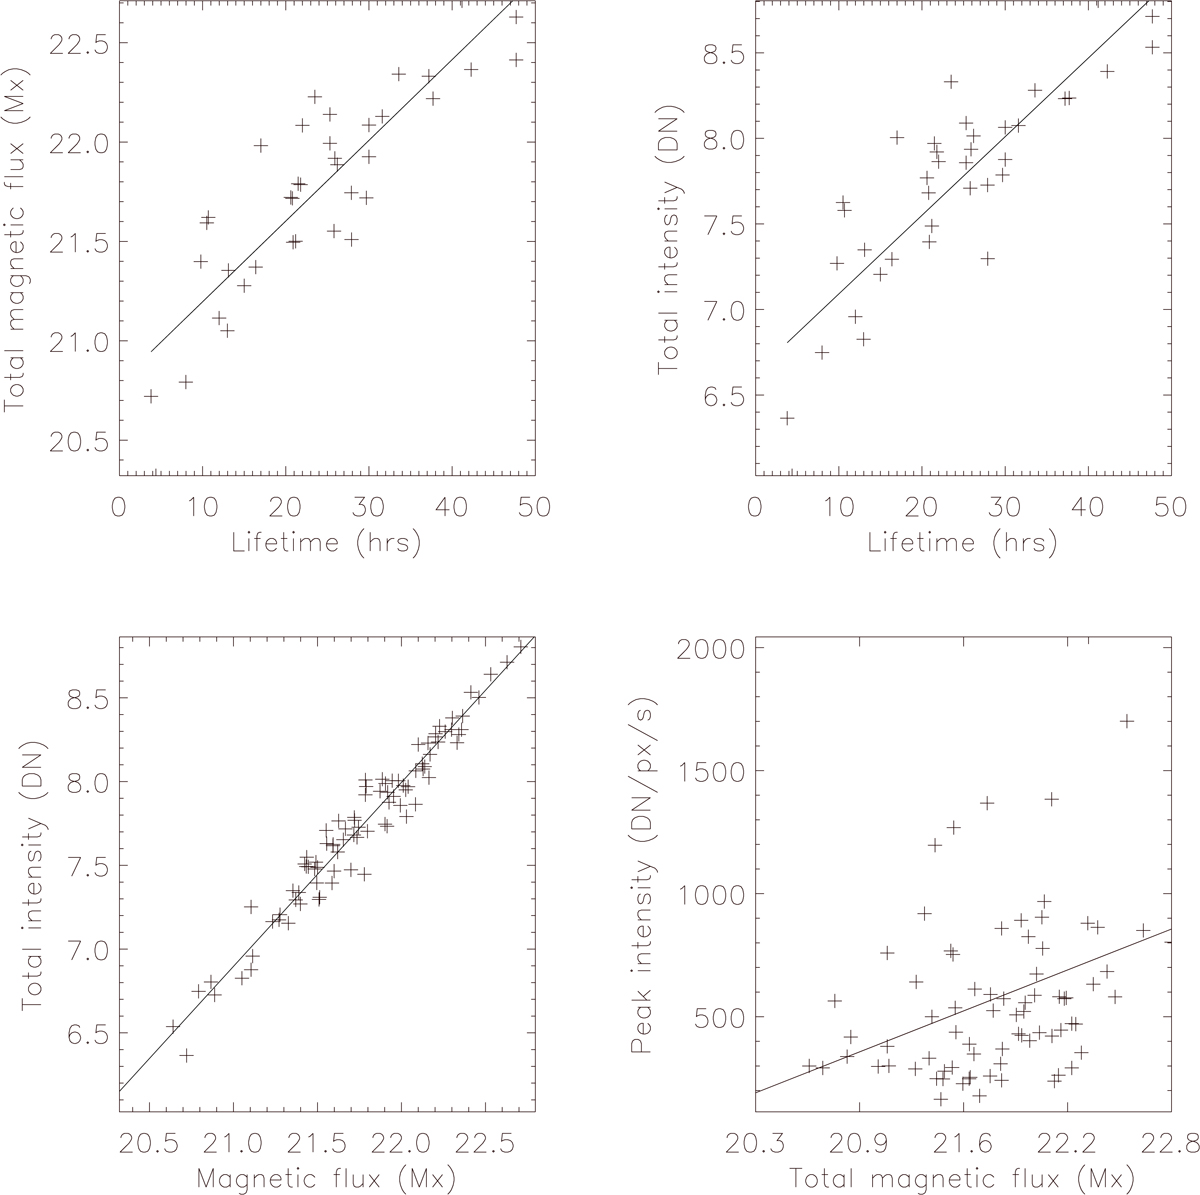
Download original image
Scatter plots. The log10 of the maximum total unsigned (over lifetime) magnetic flux vs. the lifetime duration of SSLSs is shown in the top left panel. The log10 of the maximum total intensity flux (over lifetime) vs. lifetime duration of SSLSs is shown in the top right panel, while the log10 of the maximum total intensity flux (over lifetime) vs. the log10 of the maximum total unsigned magnetic flux is shown in the bottom left panel. The two top panels include only full-lifetime covered cases, and the bottom left panel includes all 90 cases. The bottom right panel shows the peak intensity associated with microflares vs. the log10 of the maximum total unsigned magnetic flux. The abbreviation MF in the last column of Table 1 indicates the identified 77 cases.
Current usage metrics show cumulative count of Article Views (full-text article views including HTML views, PDF and ePub downloads, according to the available data) and Abstracts Views on Vision4Press platform.
Data correspond to usage on the plateform after 2015. The current usage metrics is available 48-96 hours after online publication and is updated daily on week days.
Initial download of the metrics may take a while.