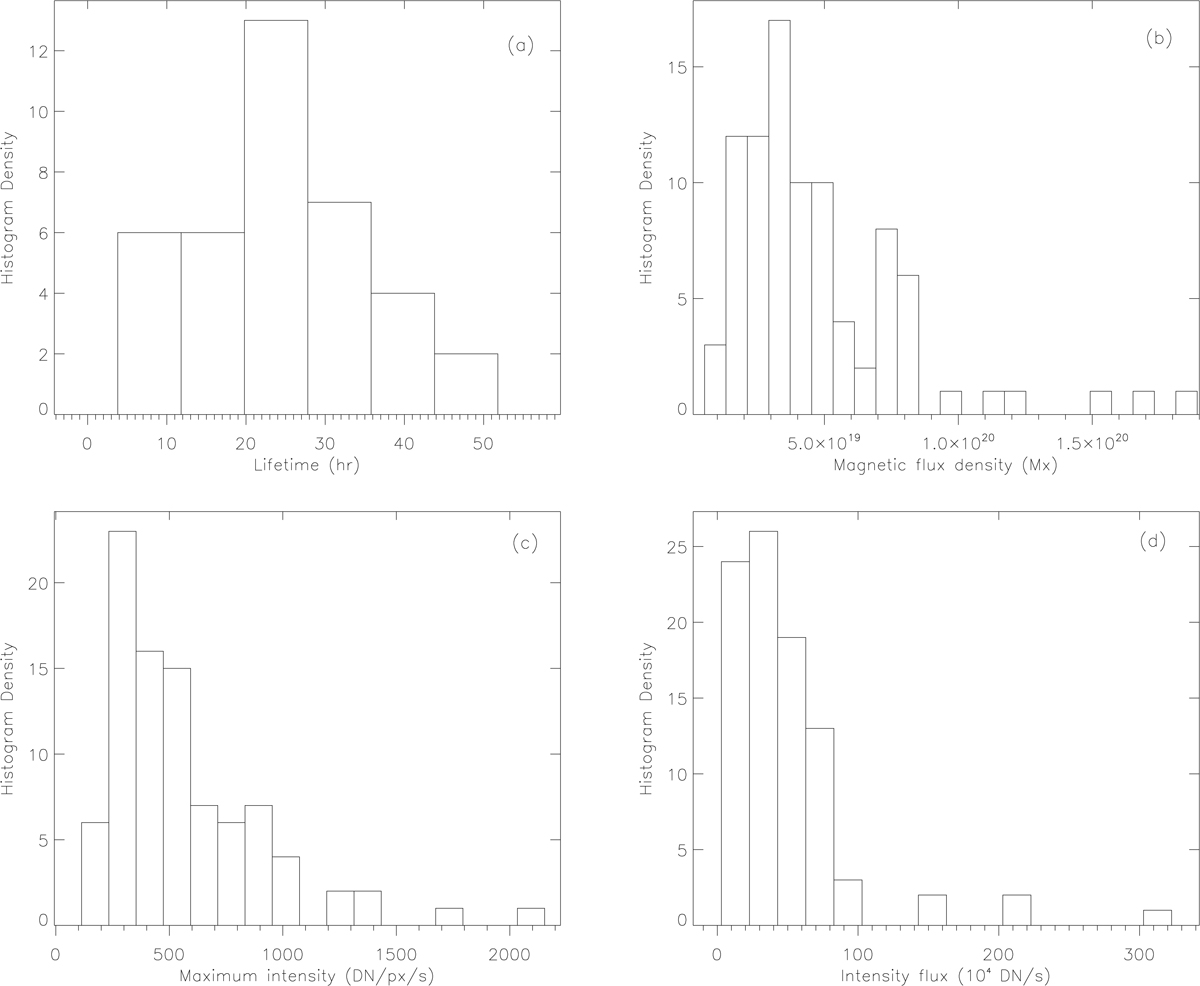
Fig. 12.
Download original image
Histograms of the physical quantities. Panel a shows the lifetimes of SSLSs for 38 cases whose lifetimes are fully covered. The maximum total unsigned magnetic flux for all 90 cases is given in panel b; see Table 1, Col. 3. The maximum peak intensities associated with microflares of SSLSs for all 90 cases are shown in panel c; see Table 1, Col. 5. The maximum total intensity flux of SSLSs for all 90 cases is provided in panel d; see Table 1, Col. 6.
Current usage metrics show cumulative count of Article Views (full-text article views including HTML views, PDF and ePub downloads, according to the available data) and Abstracts Views on Vision4Press platform.
Data correspond to usage on the plateform after 2015. The current usage metrics is available 48-96 hours after online publication and is updated daily on week days.
Initial download of the metrics may take a while.