Fig. 6.
Download original image
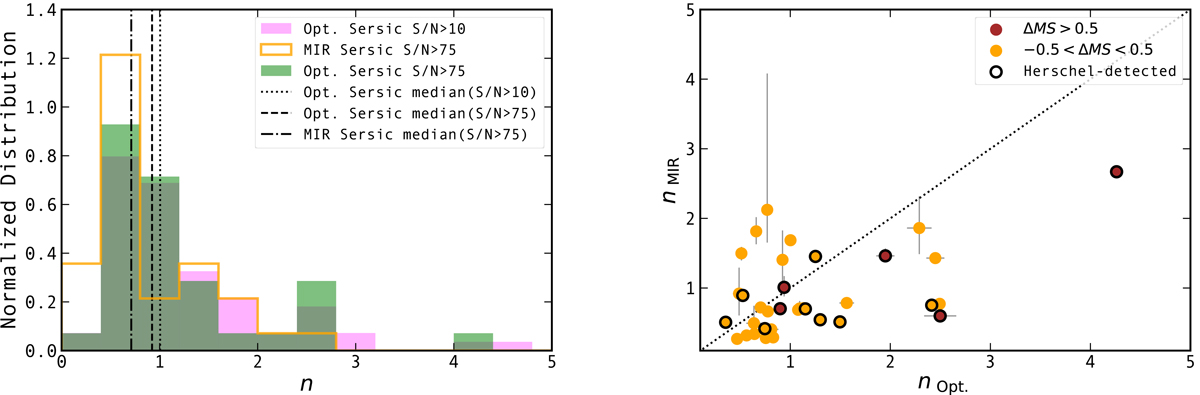
Sérsic indices of our final sample. Left: distributions of the rest-optical and rest-MIR Sérsic indices for our final sample. The green and magenta distributions correspond to the rest-optical Sérsic indices of our S/N > 75 and S/N > 10 samples, respectively. The orange distribution corresponds to the rest-MIR Sérsic indices of our S/N > 75 sample. The vertical dashed, dotted and dash-dotted lines show the median Sérsic indices of these distributions. Right: comparison of the rest-MIR and rest-optical Sérsic indices of the 35 SFGs with S/N > 75 in our final sample. Circles are color-coded by the distance of each galaxy to the MS, i.e., −0.5 < ΔMS < 0.5 (orange), and ΔMS > 0.5 (brown). Circles outlined by black edges are detected in the FIR by Herschel.
Current usage metrics show cumulative count of Article Views (full-text article views including HTML views, PDF and ePub downloads, according to the available data) and Abstracts Views on Vision4Press platform.
Data correspond to usage on the plateform after 2015. The current usage metrics is available 48-96 hours after online publication and is updated daily on week days.
Initial download of the metrics may take a while.