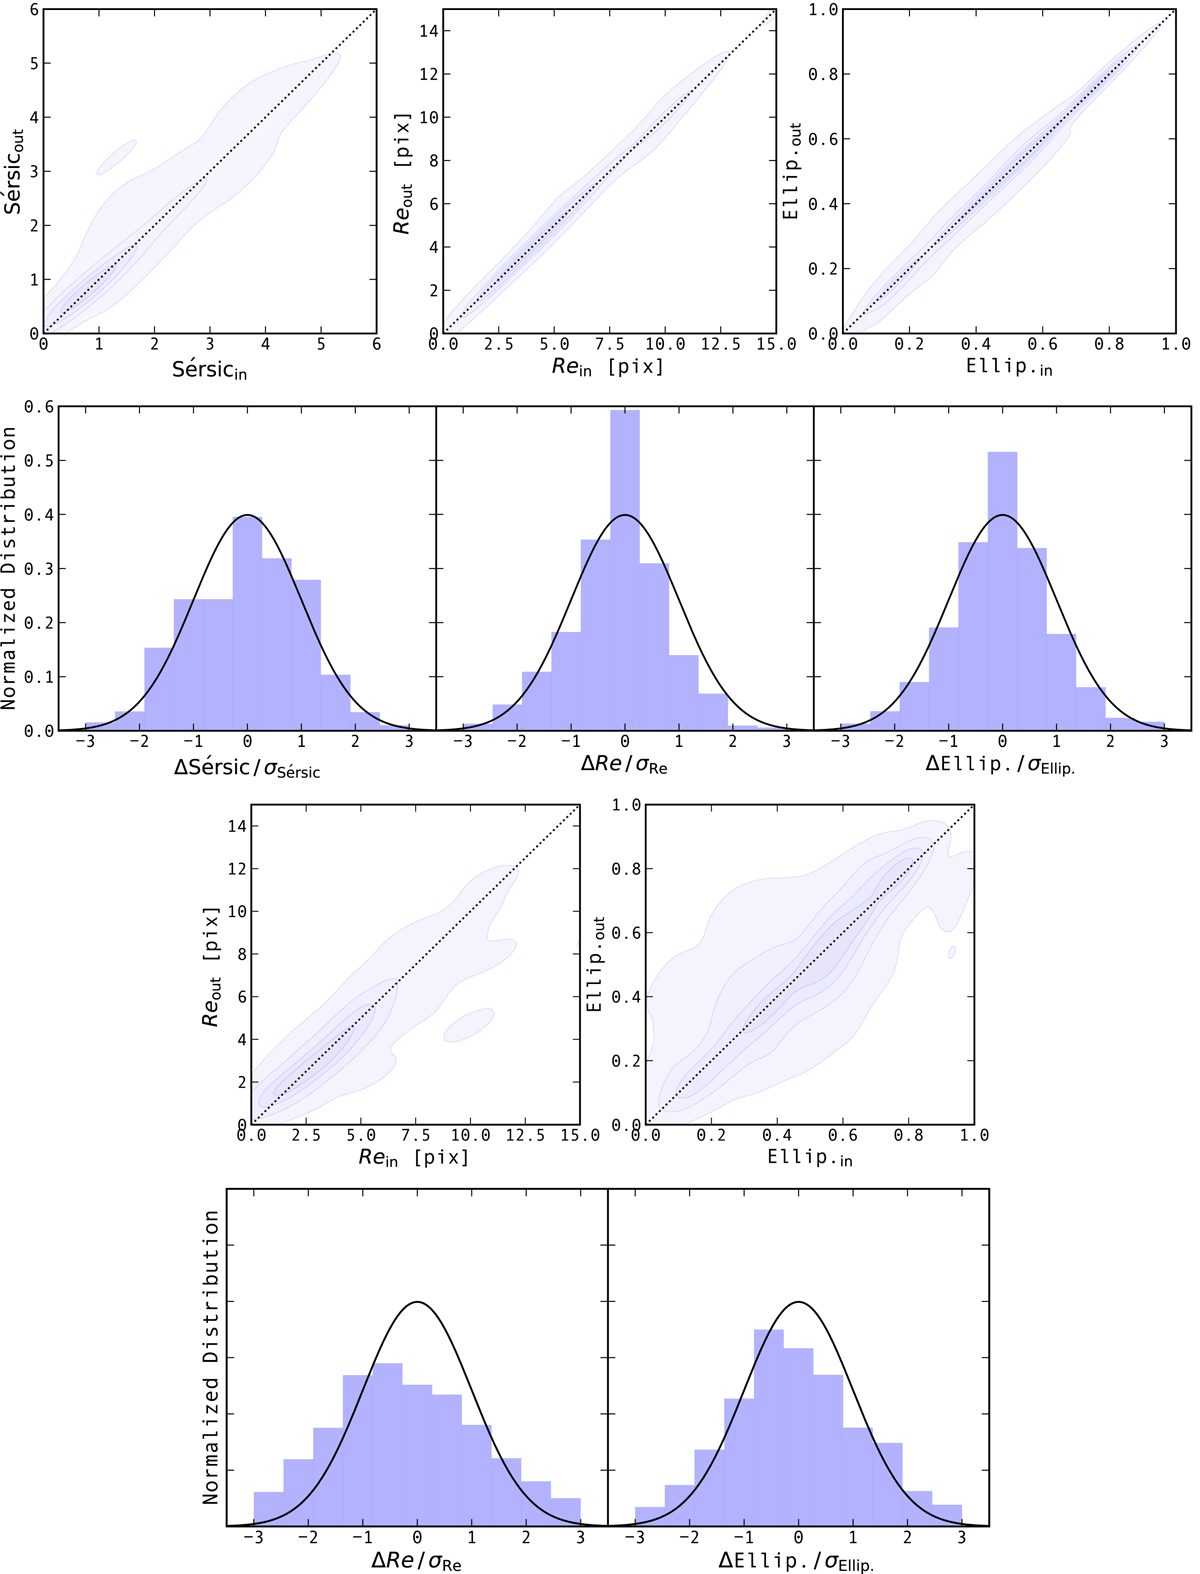
Fig. 5.
Download original image
Quality of our structural parameter measurements as inferred using Monte Carlo simulations. 1st row: comparison between the intrinsic (“in”) and measured (“out”) Sérsic indices, effective radii, and ellipticities. Shaded regions correspond to the distribution of all 3500 simulated data points, plotted using a kernel density estimator. Dotted lines show the one-to-one relation. 2nd row: distribution of the true (i.e., ΔParam = Paramin − Paramout) to estimated (i.e., σParam) error ratio (blue histogram). The solid line shows a Gaussian distribution centered on zero and with a dispersion of one, i.e., the distribution that should be followed by the blue histogram if the estimated errors were statistically accurate. In the first two rows, mock galaxies were simulated using the observed rest-MIR flux density of each galaxy with S/N > 75 in our sample and their respective rest-optical Sérsic indices and sizes. Structural parameters were then retrieved using the MCMC approach described in Sect. 3. 3rd row and 4th row: same as the first two rows but for simulations performed using the observed rest-MIR flux density of galaxies with 10 < S/N < 75 and their respective rest-optical Sérsic indices and sizes. Structural parameters were then retrieved using the MCMC approach described in Sect. 3 but fixing the Sérsic index to 1.
Current usage metrics show cumulative count of Article Views (full-text article views including HTML views, PDF and ePub downloads, according to the available data) and Abstracts Views on Vision4Press platform.
Data correspond to usage on the plateform after 2015. The current usage metrics is available 48-96 hours after online publication and is updated daily on week days.
Initial download of the metrics may take a while.