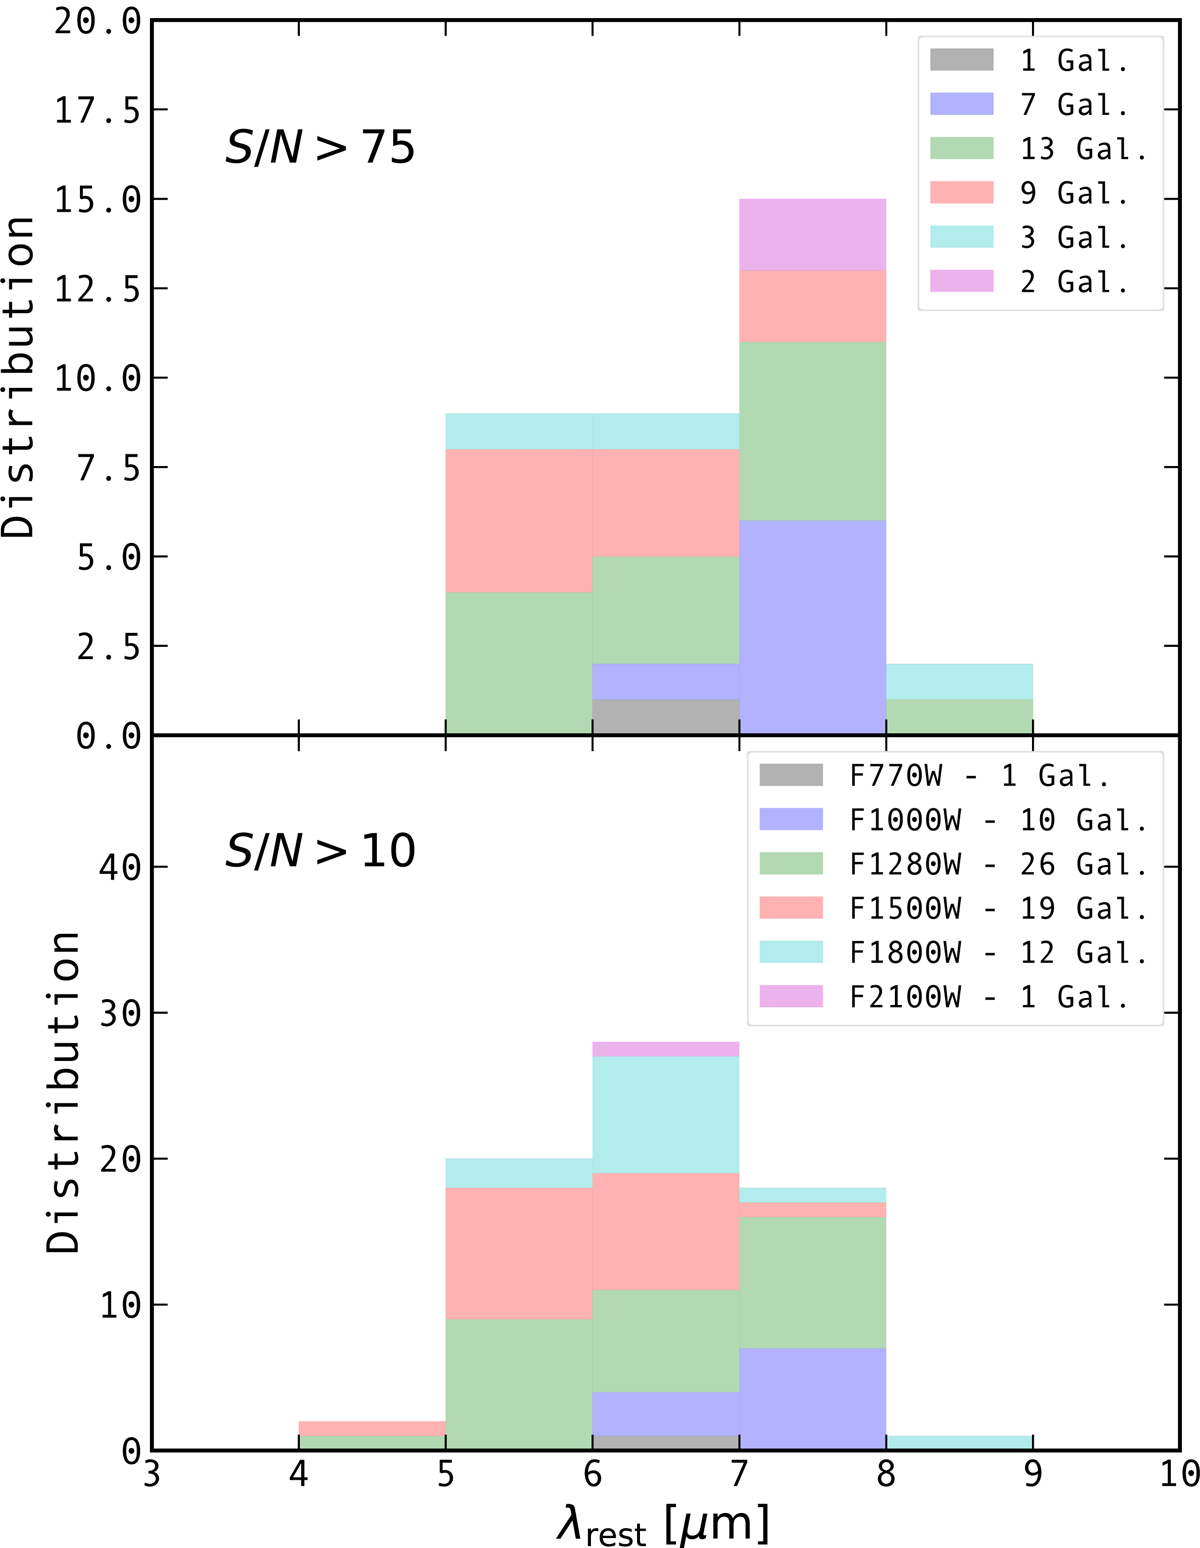
Fig. 3.
Download original image
Distributions of rest-MIR wavelengths probed by the sharpest MIRI band (shortest wavelength) with a detection dominated by dust emission, for our S/N > 75 (upper panel) and S/N > 10 (lower panel) samples. The colors of these stacked distributions correspond to the MIRI band used. The total number of galaxies in a given MIRI band is shown in the legend of each panel.
Current usage metrics show cumulative count of Article Views (full-text article views including HTML views, PDF and ePub downloads, according to the available data) and Abstracts Views on Vision4Press platform.
Data correspond to usage on the plateform after 2015. The current usage metrics is available 48-96 hours after online publication and is updated daily on week days.
Initial download of the metrics may take a while.