Fig. 2.
Download original image
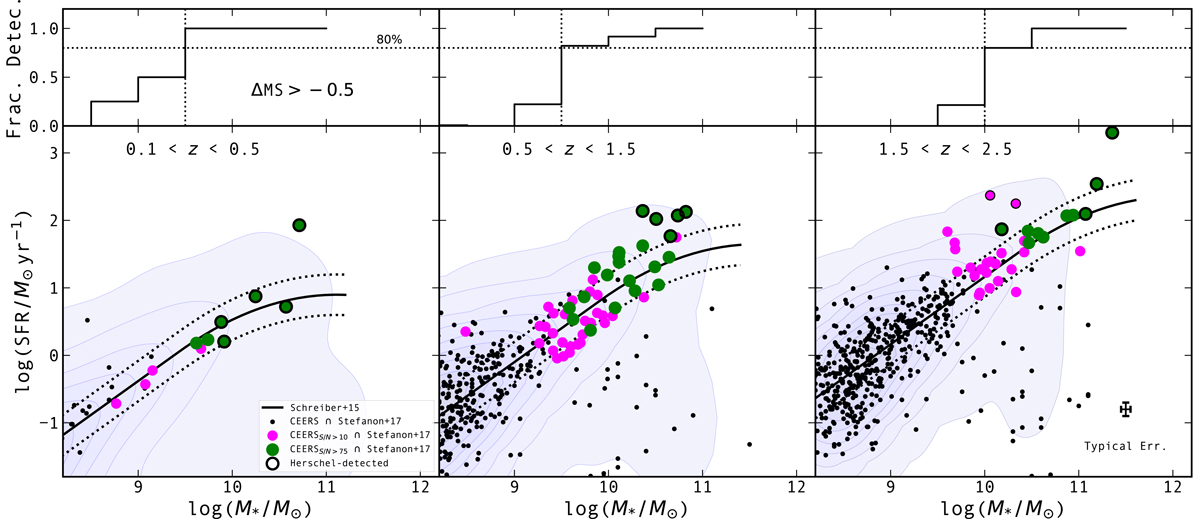
Star formation rate vs. stellar mass distribution in three redshift ranges, i.e., 0.1 < z < 0.5, 0.5 < z < 1.5, and 1.5 < z < 2.5 (lower panels). Filled green and magenta circles correspond to rest-MIR detection with S/N > 75 and 10 < S/N < 75, respectively. Circles outlined by black edges are detected in the FIR by Herschel (i.e., with S/NFIR > 5, where S/NFIR is the signal-to-noise ratios added in quadrature from 100 to 500 μm; Le Bail et al., in prep.). Black dots show galaxies within the four CEERS red MIRI fields but which remained undetected in a MIRI bandpass that is dominated by dust emission (i.e., S/N < 10 or ![]() ). Shaded regions correspond to the distribution of all sources in the EGS, plotted using a kernel density estimator. The solid and dotted black lines show the MS of SFGs and its dispersion as inferred by Schreiber et al. (2015). Upper panels: fraction of SFGs (i.e., ΔMS > −0.5) as a function of stellar mass which are within the four CEERS red MIRI fields and are in our sample (i.e., that have at least one S/N > 10 MIRI detection dominated by dust emission). Our sample is 80% mass-complete down to M* ∼ 109.5, 109.5, and 1010 M⊙ at z ∼ 0.3, 1.0, and 2.0, respectively. A typical 1σ error bar for individual objects is shown in the right panel.
). Shaded regions correspond to the distribution of all sources in the EGS, plotted using a kernel density estimator. The solid and dotted black lines show the MS of SFGs and its dispersion as inferred by Schreiber et al. (2015). Upper panels: fraction of SFGs (i.e., ΔMS > −0.5) as a function of stellar mass which are within the four CEERS red MIRI fields and are in our sample (i.e., that have at least one S/N > 10 MIRI detection dominated by dust emission). Our sample is 80% mass-complete down to M* ∼ 109.5, 109.5, and 1010 M⊙ at z ∼ 0.3, 1.0, and 2.0, respectively. A typical 1σ error bar for individual objects is shown in the right panel.
Current usage metrics show cumulative count of Article Views (full-text article views including HTML views, PDF and ePub downloads, according to the available data) and Abstracts Views on Vision4Press platform.
Data correspond to usage on the plateform after 2015. The current usage metrics is available 48-96 hours after online publication and is updated daily on week days.
Initial download of the metrics may take a while.