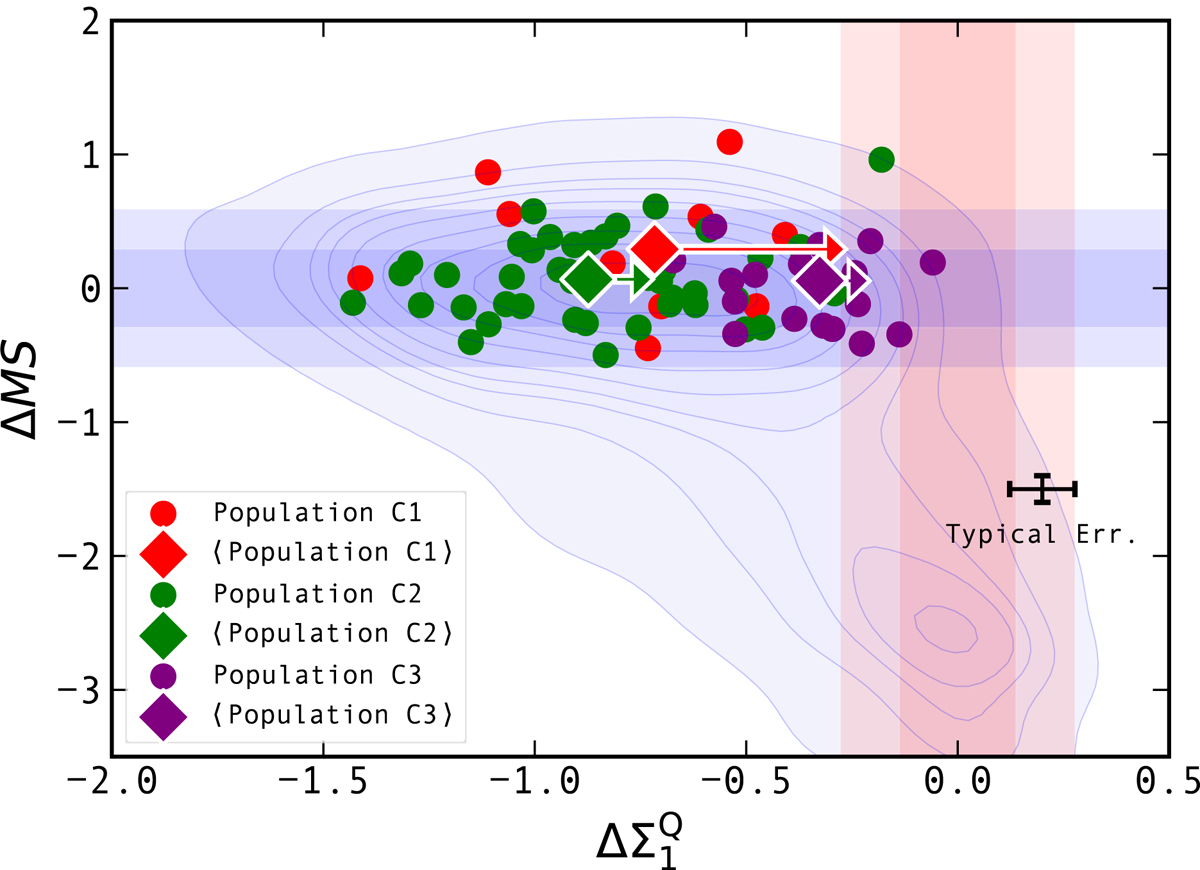
Fig. 13.
Download original image
Distance to the MS as a function of the distance to the mass–Σ1 relation of QGs (![]() ; see Barro et al. 2017) for the 69 SFGs in our final sample. Green circles correspond to the population of galaxies with extended star-forming and stellar components (C1); red circles correspond to the population of galaxies with a compact star-forming component embedded in an extended stellar component (C2); and finally, purple circles correspond to the population of galaxies with compact star-forming and stellar components (C3). Green, red, and purple diamonds show the median values of these populations. The median increases of
; see Barro et al. 2017) for the 69 SFGs in our final sample. Green circles correspond to the population of galaxies with extended star-forming and stellar components (C1); red circles correspond to the population of galaxies with a compact star-forming component embedded in an extended stellar component (C2); and finally, purple circles correspond to the population of galaxies with compact star-forming and stellar components (C3). Green, red, and purple diamonds show the median values of these populations. The median increases of ![]() for these three different populations of galaxies are displayed by right-pointing arrows (see text for details of this calculation). Contours correspond to the distribution of all sources in the EGS, plotted using a kernel density estimator. The blue regions show the 1- and 2-σ dispersion of the MS, while the red regions show the 1- and 2-σ dispersion of the mass–
for these three different populations of galaxies are displayed by right-pointing arrows (see text for details of this calculation). Contours correspond to the distribution of all sources in the EGS, plotted using a kernel density estimator. The blue regions show the 1- and 2-σ dispersion of the MS, while the red regions show the 1- and 2-σ dispersion of the mass–![]() relation. A typical 1σ error bar for individual objects is shown in the bottom right.
relation. A typical 1σ error bar for individual objects is shown in the bottom right.
Current usage metrics show cumulative count of Article Views (full-text article views including HTML views, PDF and ePub downloads, according to the available data) and Abstracts Views on Vision4Press platform.
Data correspond to usage on the plateform after 2015. The current usage metrics is available 48-96 hours after online publication and is updated daily on week days.
Initial download of the metrics may take a while.