Fig. 12.
Download original image
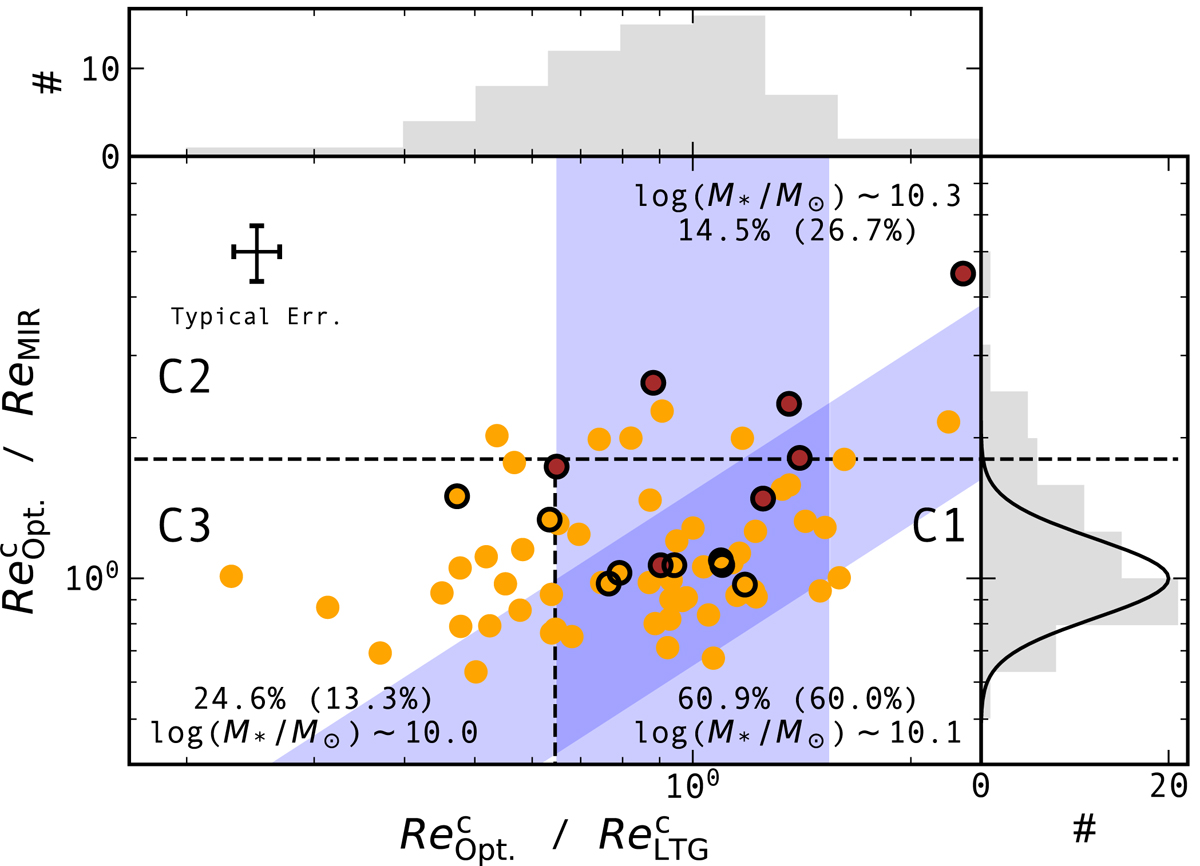
Rest-optical to rest-MIR size ratios for the 69 SFGs in our final sample as a function of the distance of their rest-optical sizes to the size–mass relation of LTGs (i.e., ![]() ). Right and upper panels: present the distributions of these two quantities. Circles are color-coded by the distance of each galaxy to the MS, i.e., −0.5 < ΔMS < 0.5 (orange), and ΔMS > 0.5 (brown). Circles outlined by black edges are detected in the FIR by Herschel. A typical 1σ error bar for individual objects is shown in the upper left. Galaxies within the vertical (diagonal) blue-shaded region have their rest-optical (rest-MIR) sizes well within the size–mass relation of LTGs (σ ∼ 0.19 dex; van der Wel et al. 2014). The numbers in each frame provide the median stellar mass as well as the fraction of galaxies in each of these three populations above our mass completeness limits and above > 1010.5 M⊙ in parenthesis: galaxies with extended star-forming and stellar components (C1); galaxies with a compact star-forming component embedded in a extended stellar component (C2); and finally, galaxies with compact star-forming and stellar components (C3).
). Right and upper panels: present the distributions of these two quantities. Circles are color-coded by the distance of each galaxy to the MS, i.e., −0.5 < ΔMS < 0.5 (orange), and ΔMS > 0.5 (brown). Circles outlined by black edges are detected in the FIR by Herschel. A typical 1σ error bar for individual objects is shown in the upper left. Galaxies within the vertical (diagonal) blue-shaded region have their rest-optical (rest-MIR) sizes well within the size–mass relation of LTGs (σ ∼ 0.19 dex; van der Wel et al. 2014). The numbers in each frame provide the median stellar mass as well as the fraction of galaxies in each of these three populations above our mass completeness limits and above > 1010.5 M⊙ in parenthesis: galaxies with extended star-forming and stellar components (C1); galaxies with a compact star-forming component embedded in a extended stellar component (C2); and finally, galaxies with compact star-forming and stellar components (C3).
Current usage metrics show cumulative count of Article Views (full-text article views including HTML views, PDF and ePub downloads, according to the available data) and Abstracts Views on Vision4Press platform.
Data correspond to usage on the plateform after 2015. The current usage metrics is available 48-96 hours after online publication and is updated daily on week days.
Initial download of the metrics may take a while.