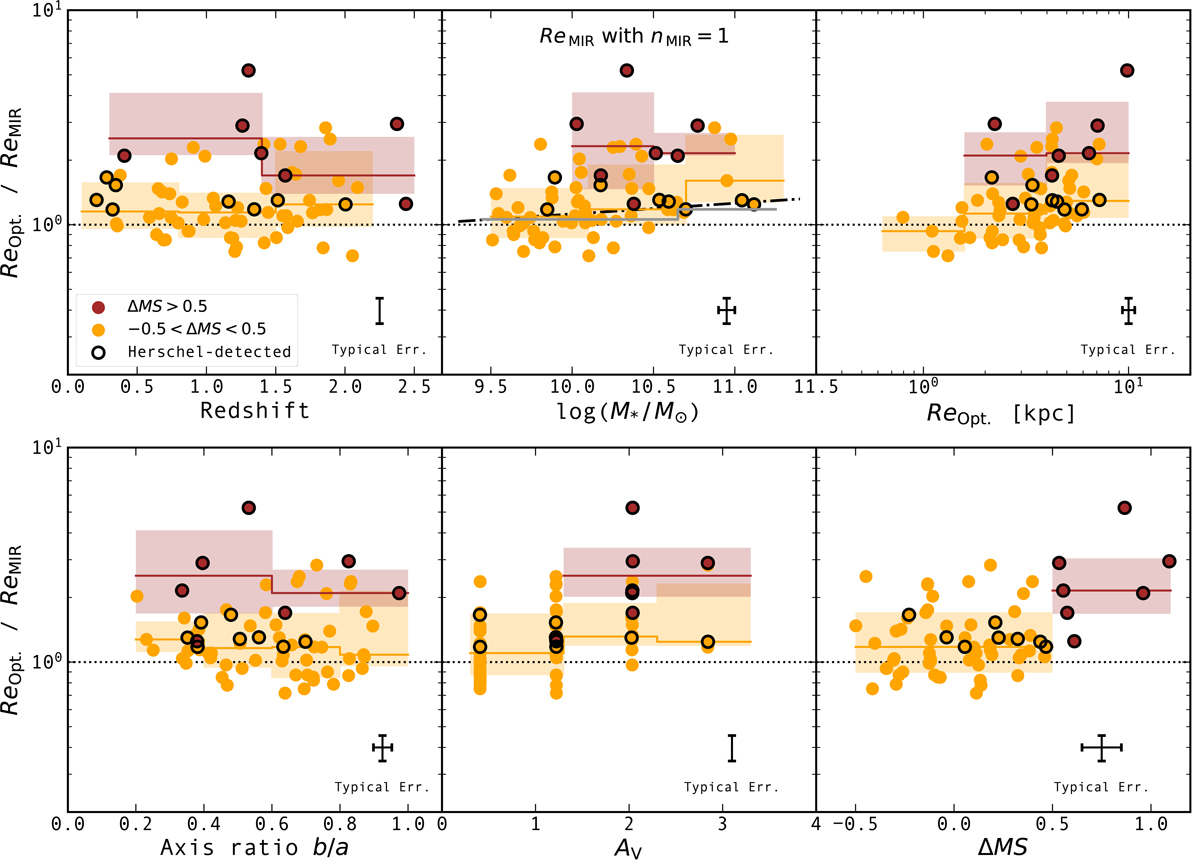
Fig. 11.
Download original image
Rest-optical to rest-MIR size ratios for the 69 SFGs in our final sample as a function of their redshifts, stellar masses, rest-optical sizes, axis ratio, dust attenuation, and distances to the MS. Circles are color-coded by the distance of each galaxy to the MS, i.e., −0.5 < ΔMS < 0.5 (orange), and ΔMS > 0.5 (brown). Circles outlined by black edges are detected in the FIR by Herschel. Brown line and shaded region show the median and 16th and 84th percentiles of starbursts (ΔMS > 0.5) in bins of redshift, stellar mass, rest-optical effective radius, axis ratio, dust attenuation, and distance to the MS, respectively. Orange regions display the same quantities but for MS galaxies. These rest-MIR sizes were inferred by setting nMIR = 1 during our partial structural parameter analysis. In the upper central panel, we show as dash-dotted line the mass-dependent rest-optical to rest-NIR size ratio found in Suess et al. (2022), and as gray line, the median for MS galaxies when replacing the rest-optical sizes of 18 galaxies by their rest-NIR sizes measured on their MIRI 7.7 μm images which are, according to our CIGALE SED fits, dominated by their stellar component. Typical 1σ error bars for individual objects are shown in each panel. The discretized values along the dust attenuation axis correspond to the sampling of this parameter used for our CIGALE fits.
Current usage metrics show cumulative count of Article Views (full-text article views including HTML views, PDF and ePub downloads, according to the available data) and Abstracts Views on Vision4Press platform.
Data correspond to usage on the plateform after 2015. The current usage metrics is available 48-96 hours after online publication and is updated daily on week days.
Initial download of the metrics may take a while.