Fig. 10.
Download original image
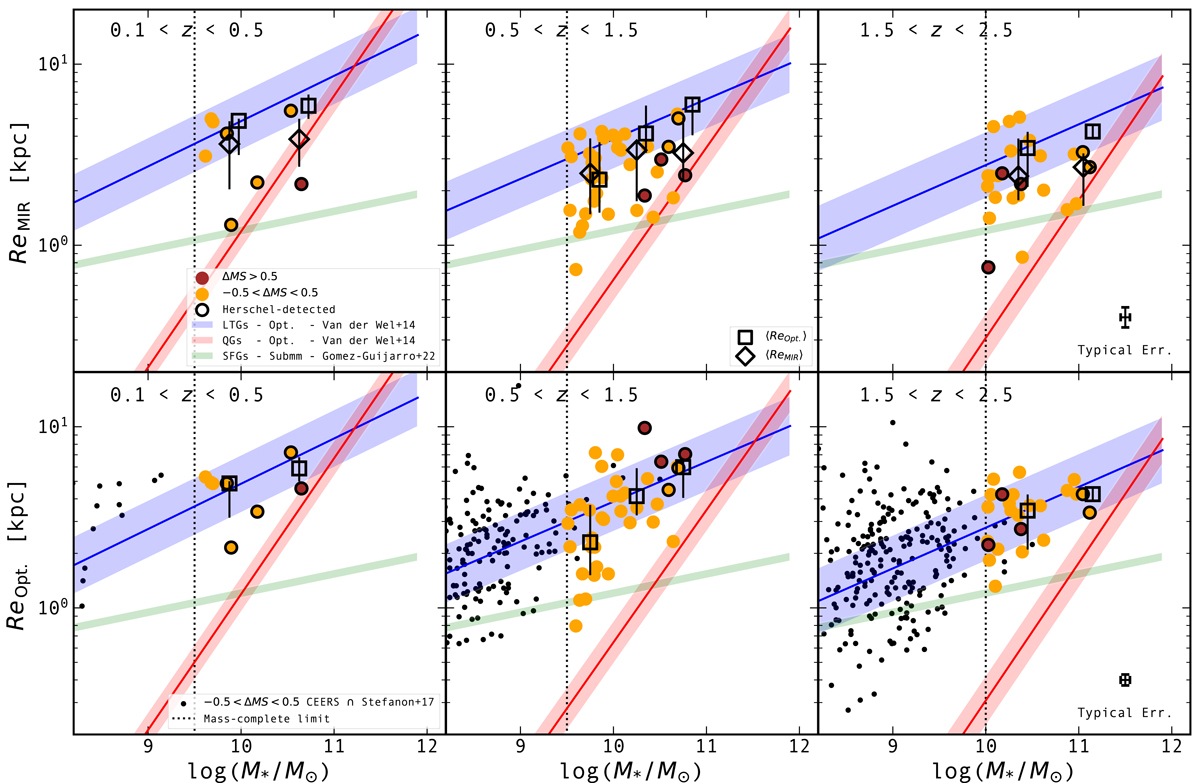
Rest-MIR size–mass (upper panels) and rest-optical size–mass (lower panels) distributions of the 69 SFGs in our final sample. Circles are color-coded by the distance of each galaxy to the MS, i.e., −0.5 < ΔMS < 0.5 (orange), and ΔMS > 0.5 (brown). Circles outlined by black edges are detected in the FIR by Herschel. The rest-MIR sizes were inferred by setting nMIR = 1 during our partial structural parameter analysis. Black dots show galaxies within the four CEERS red MIRI fields but which remained undetected in a MIRI bandpass that is dominated by dust emission (i.e., S/N < 10 or ![]() ). Open diamonds and squares show the 16th, 50th, and 84th percentiles of the rest-MIR and rest-optical size distributions in bins of stellar mass, respectively. Squares (rest-optical sizes) are reproduced in the upper panels for comparison to the rest-MIR sizes and have been shifted by 0.1 dex along the x-axis for clarity. The blue- and red-shaded regions correspond to the size–mass relation inferred in the rest-optical by van der Wel et al. (2014) for late-type and early-type galaxies, respectively. The green-shaded region shows the size–mass relation inferred in the submm by Gómez-Guijarro et al. (2022a) using mostly massive (∼1010.8 M⊙) and high-redshift (z ∼ 2.5) SFGs. Here, we assumed a mean axis ratio of 0.5 (see Fig. 7) to convert their circularized radii into semi-major axis radii. Vertical dotted lines show the mass completeness limits of our sample. Typical 1σ error bars for individual objects are shown in the upper and lower right panels.
). Open diamonds and squares show the 16th, 50th, and 84th percentiles of the rest-MIR and rest-optical size distributions in bins of stellar mass, respectively. Squares (rest-optical sizes) are reproduced in the upper panels for comparison to the rest-MIR sizes and have been shifted by 0.1 dex along the x-axis for clarity. The blue- and red-shaded regions correspond to the size–mass relation inferred in the rest-optical by van der Wel et al. (2014) for late-type and early-type galaxies, respectively. The green-shaded region shows the size–mass relation inferred in the submm by Gómez-Guijarro et al. (2022a) using mostly massive (∼1010.8 M⊙) and high-redshift (z ∼ 2.5) SFGs. Here, we assumed a mean axis ratio of 0.5 (see Fig. 7) to convert their circularized radii into semi-major axis radii. Vertical dotted lines show the mass completeness limits of our sample. Typical 1σ error bars for individual objects are shown in the upper and lower right panels.
Current usage metrics show cumulative count of Article Views (full-text article views including HTML views, PDF and ePub downloads, according to the available data) and Abstracts Views on Vision4Press platform.
Data correspond to usage on the plateform after 2015. The current usage metrics is available 48-96 hours after online publication and is updated daily on week days.
Initial download of the metrics may take a while.