Fig. 1.
Download original image
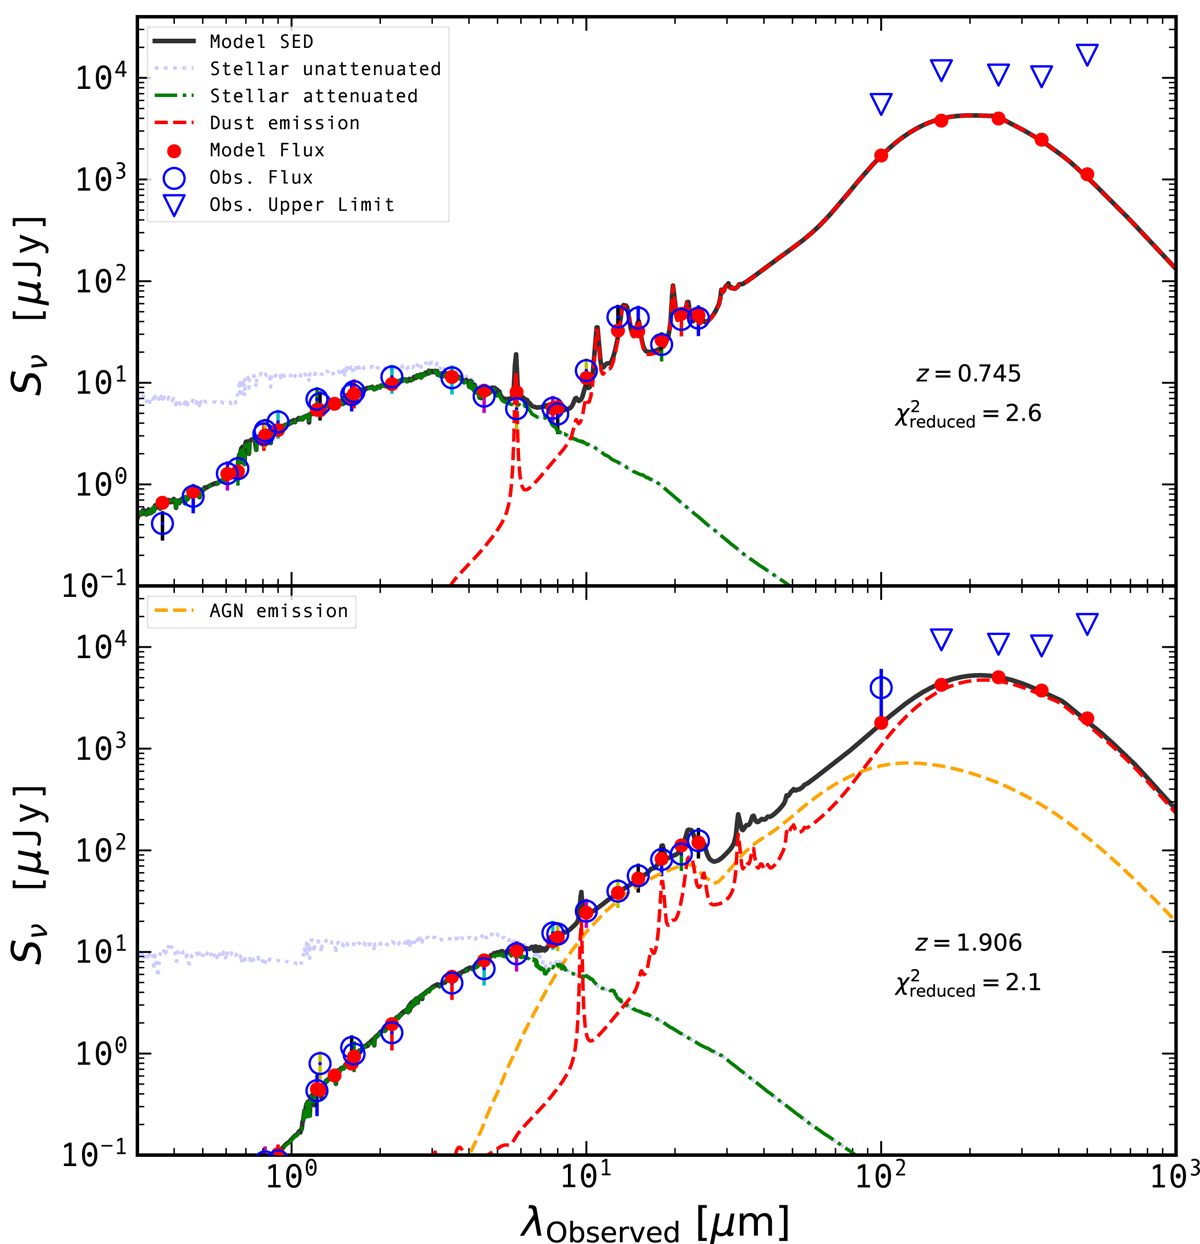
Spectral energy distribution (SED) of two of our galaxies (upper panel: ID 12091; lower panel: ID 19062) as fit using CIGALE. Observed flux densities are shown by opened blue circles, while observed upper limits are shown by downward blue triangles. Black, red, orange, blue, and green lines correspond to the total, dust, AGN, stellar unattenuated and stellar attenuated emission, respectively. For the galaxy ID 12091, the AGN contribution (i.e., LAGN/(LAGN + Ldust) is of 0% and the sharpest MIRI band (shortest wavelength) dominated by dust emission (i.e., ![]() ) is the 10 μm band. For the galaxy ID 19062, the AGN contribution is of 30% and none of the MIRI bands is dominated by dust emission.
) is the 10 μm band. For the galaxy ID 19062, the AGN contribution is of 30% and none of the MIRI bands is dominated by dust emission.
Current usage metrics show cumulative count of Article Views (full-text article views including HTML views, PDF and ePub downloads, according to the available data) and Abstracts Views on Vision4Press platform.
Data correspond to usage on the plateform after 2015. The current usage metrics is available 48-96 hours after online publication and is updated daily on week days.
Initial download of the metrics may take a while.