Fig. 1
Download original image
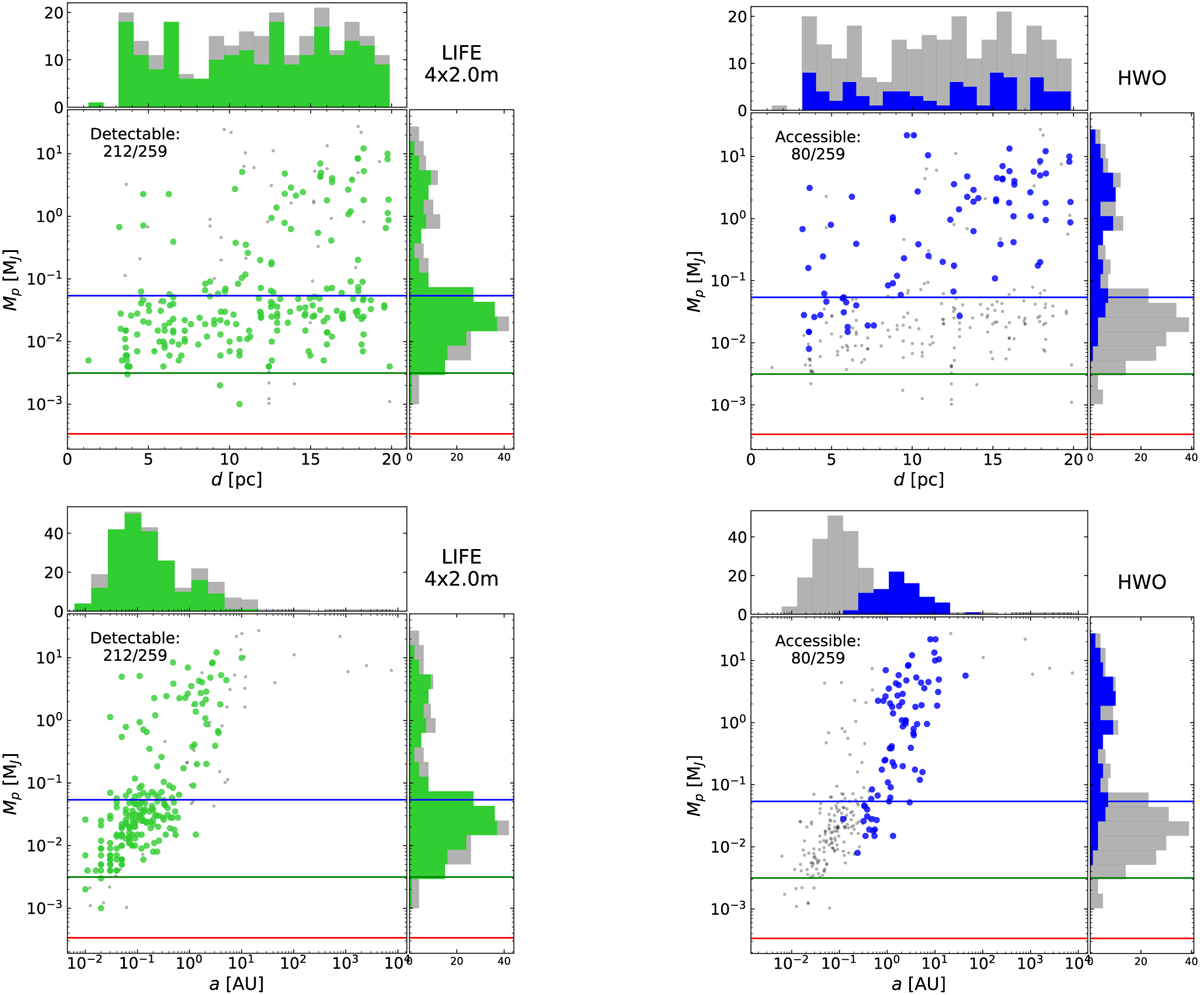
Potentially detectable currently-known exoplanets (coloured circles and histograms) compared to the total population of known exoplanets within 20 pc (grey dots and histograms), shown both as a function of their distance to the Solar System (top row) and their semimajor axis (bottom row). For LIFE (green), we assume the reference 4 × 2 m configuration with 5% throughput and consider planets as detectable if tint(S/N = 7) < 100 h. For the notional HWO (blue), potential targets in reflected starlight are those that meet our IWA, OWA and Cmin requirements (Sect. 2.3) and have Paccess > 25%. In all subplots, the value of Mp reported for the potential targets is the output of our statistical methodology (Sect. 2.1). For the non-detectable exoplanets we plot Mp or alternatively Mp sin i as reported in the NASA Archive. Horizontal lines indicate the masses of Neptune (blue), Earth (green) and Mars (red).
Current usage metrics show cumulative count of Article Views (full-text article views including HTML views, PDF and ePub downloads, according to the available data) and Abstracts Views on Vision4Press platform.
Data correspond to usage on the plateform after 2015. The current usage metrics is available 48-96 hours after online publication and is updated daily on week days.
Initial download of the metrics may take a while.