Fig. 3
Download original image
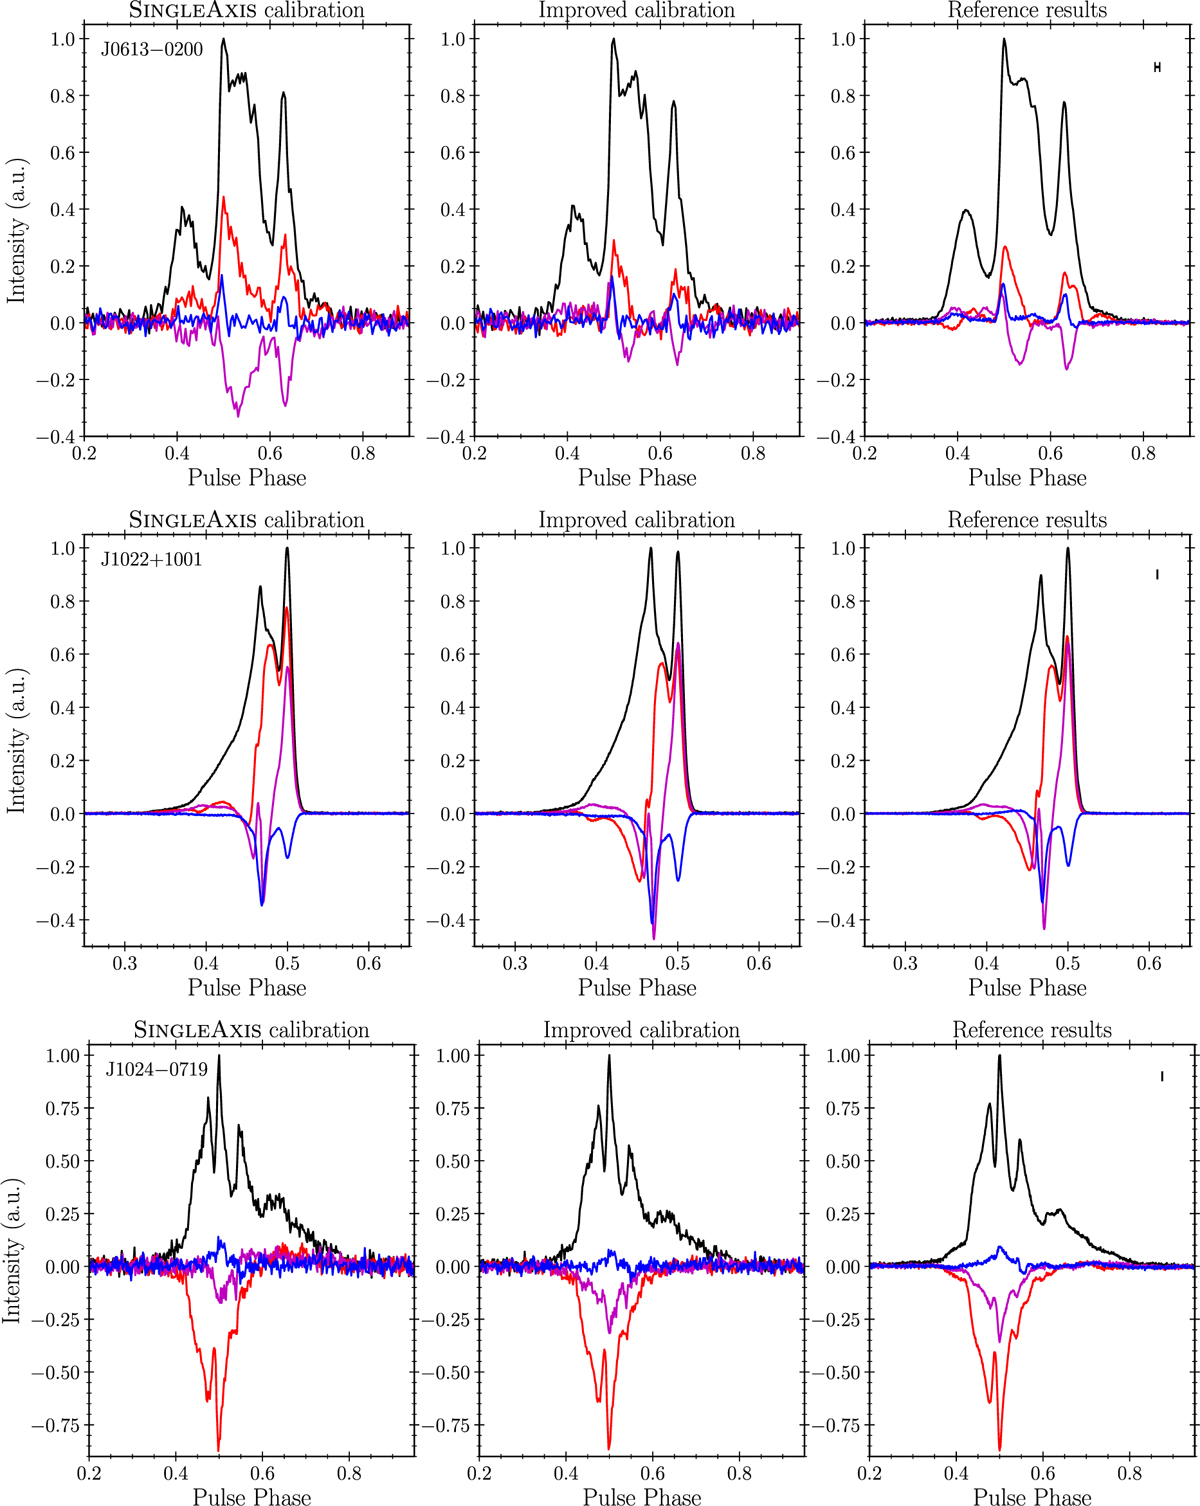
Polarimetric profiles for PSRs J0613−0200, J1022+1001, and J1024−0719. In each panel, the black line represents the total intensity (Stokes parameter I), the red and magenta lines correspond to the Stokes parameters Q and U describing the linear polarization, and the blue line is the circular polarization (Stokes parameter V). For each pulsar, the left-hand panel shows NUPPI pulse profiles calibrated with the SINGLEAXIS method as described in Sect. 2.1. The middle panel shows NUPPI polarimetric profiles calibrated with the improved scheme presented in Sect. 2.2. Reference results from Dai et al. (2015) are displayed in the right-hand panel. In the latter panel, the marker at the top right indicates the dispersion smearing resulting from incoherent dedispersion of the Parkes data. The displayed pulse phase ranges were restricted to intervals with significant emission features, to facilitate comparisons. The profiles were normalized to the maximum value of the total intensity. See Table 1 for details on the NUPPI observations presented in this figure.
Current usage metrics show cumulative count of Article Views (full-text article views including HTML views, PDF and ePub downloads, according to the available data) and Abstracts Views on Vision4Press platform.
Data correspond to usage on the plateform after 2015. The current usage metrics is available 48-96 hours after online publication and is updated daily on week days.
Initial download of the metrics may take a while.