Fig. 16
Download original image
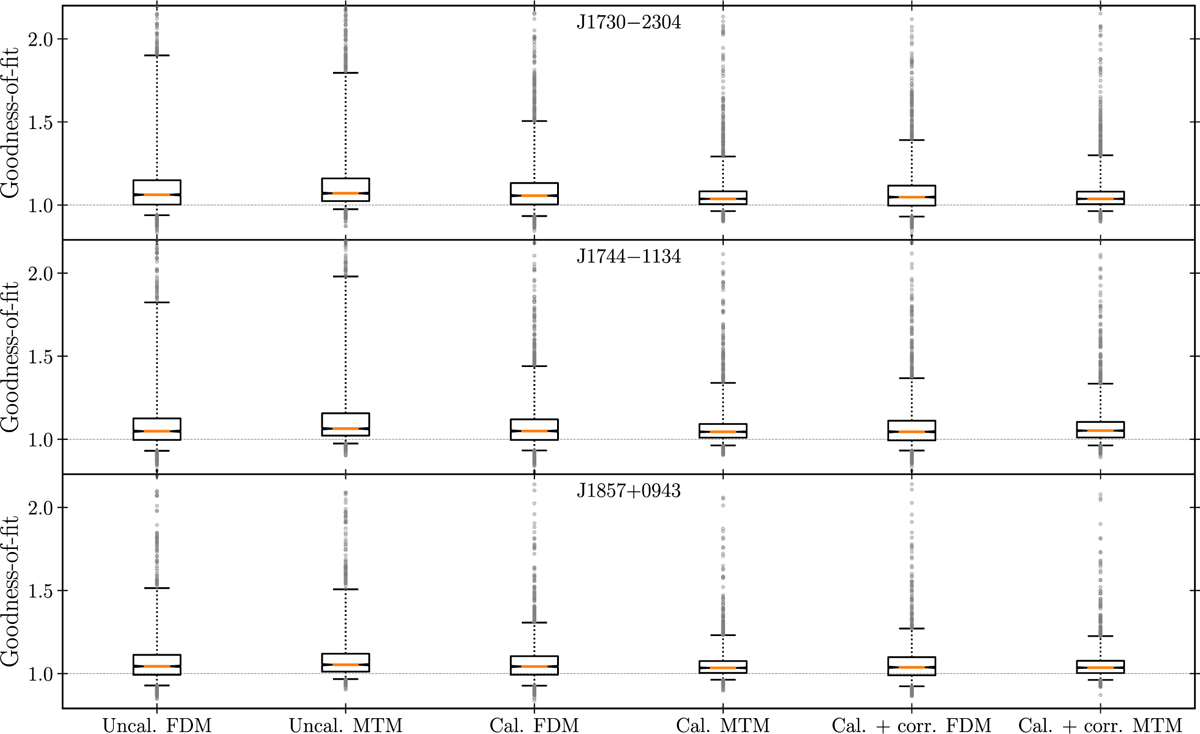
Distributions of the reduced χ2 values of the residual profiles from template matching for each TOA, for the three pulsars and six dataset types considered in Sect. 3.3. Orange lines represent the median goodness-of-fit values, boxes encompass the first to third quartiles, whiskers encompass the 5th and 95th percentiles, and gray dots represent outliers.
Current usage metrics show cumulative count of Article Views (full-text article views including HTML views, PDF and ePub downloads, according to the available data) and Abstracts Views on Vision4Press platform.
Data correspond to usage on the plateform after 2015. The current usage metrics is available 48-96 hours after online publication and is updated daily on week days.
Initial download of the metrics may take a while.