Fig. 13
Download original image
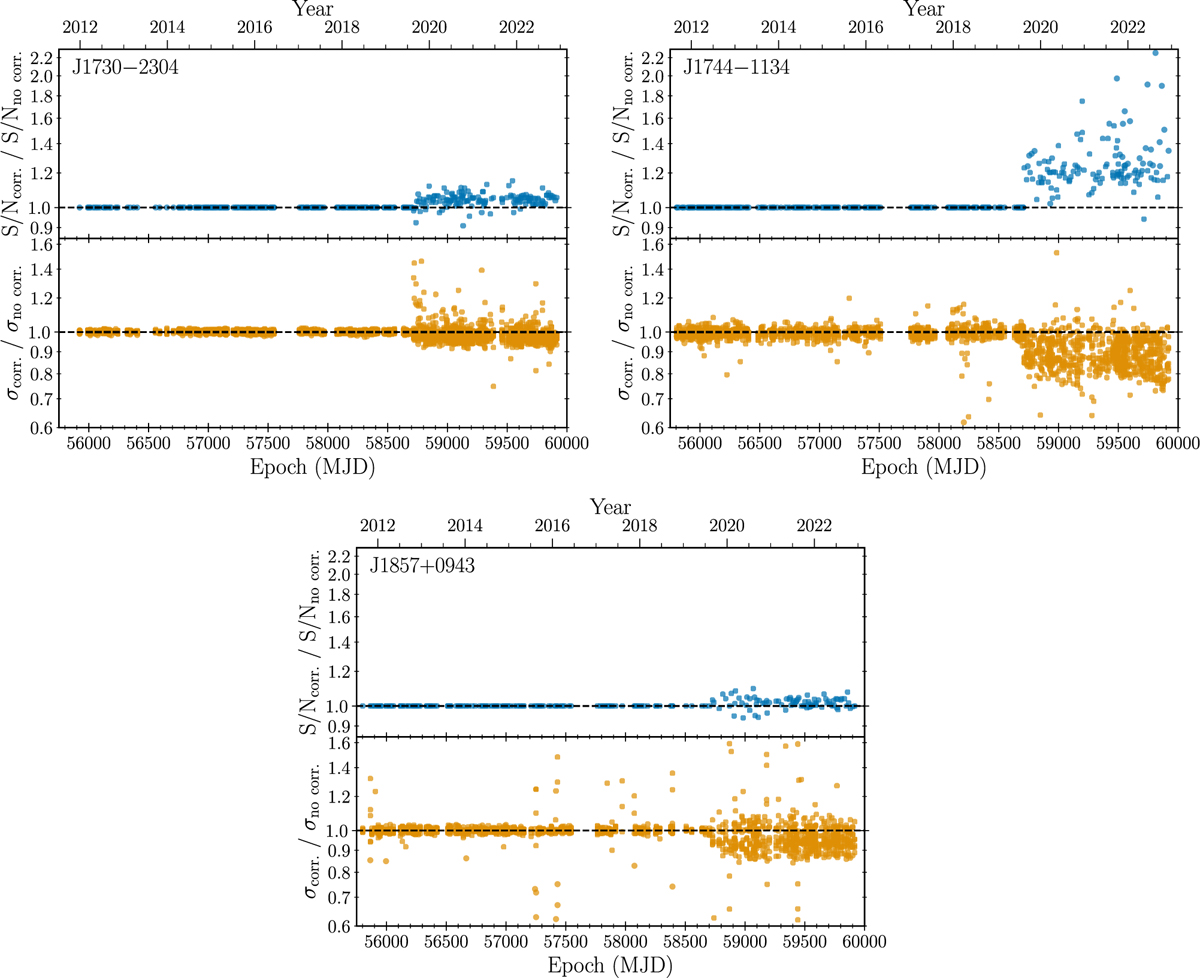
Ratios of S/N and TOA uncertainty values for PSRs J1730−2304, J1744−1134, and J1857+0943 as a function of time. The values are derived from NUPPI pulse profiles observed at 1.4 GHz and calibrated using the SINGLEAXIS method (“no corr.”) and the improved method described in Sect. 2.2 (“corr.”). For each pulsar, the top panel (blue points) shows the ratios of the S/N values and the bottom panel (orange points) shows the ratios of the TOA uncertainties. Individual observations were fully integrated in time, and integrated in frequency to form eight subbands. TOAs were extracted from the observations using the MTM technique. See Sect. 3.2 for additional details about the data preparation.
Current usage metrics show cumulative count of Article Views (full-text article views including HTML views, PDF and ePub downloads, according to the available data) and Abstracts Views on Vision4Press platform.
Data correspond to usage on the plateform after 2015. The current usage metrics is available 48-96 hours after online publication and is updated daily on week days.
Initial download of the metrics may take a while.