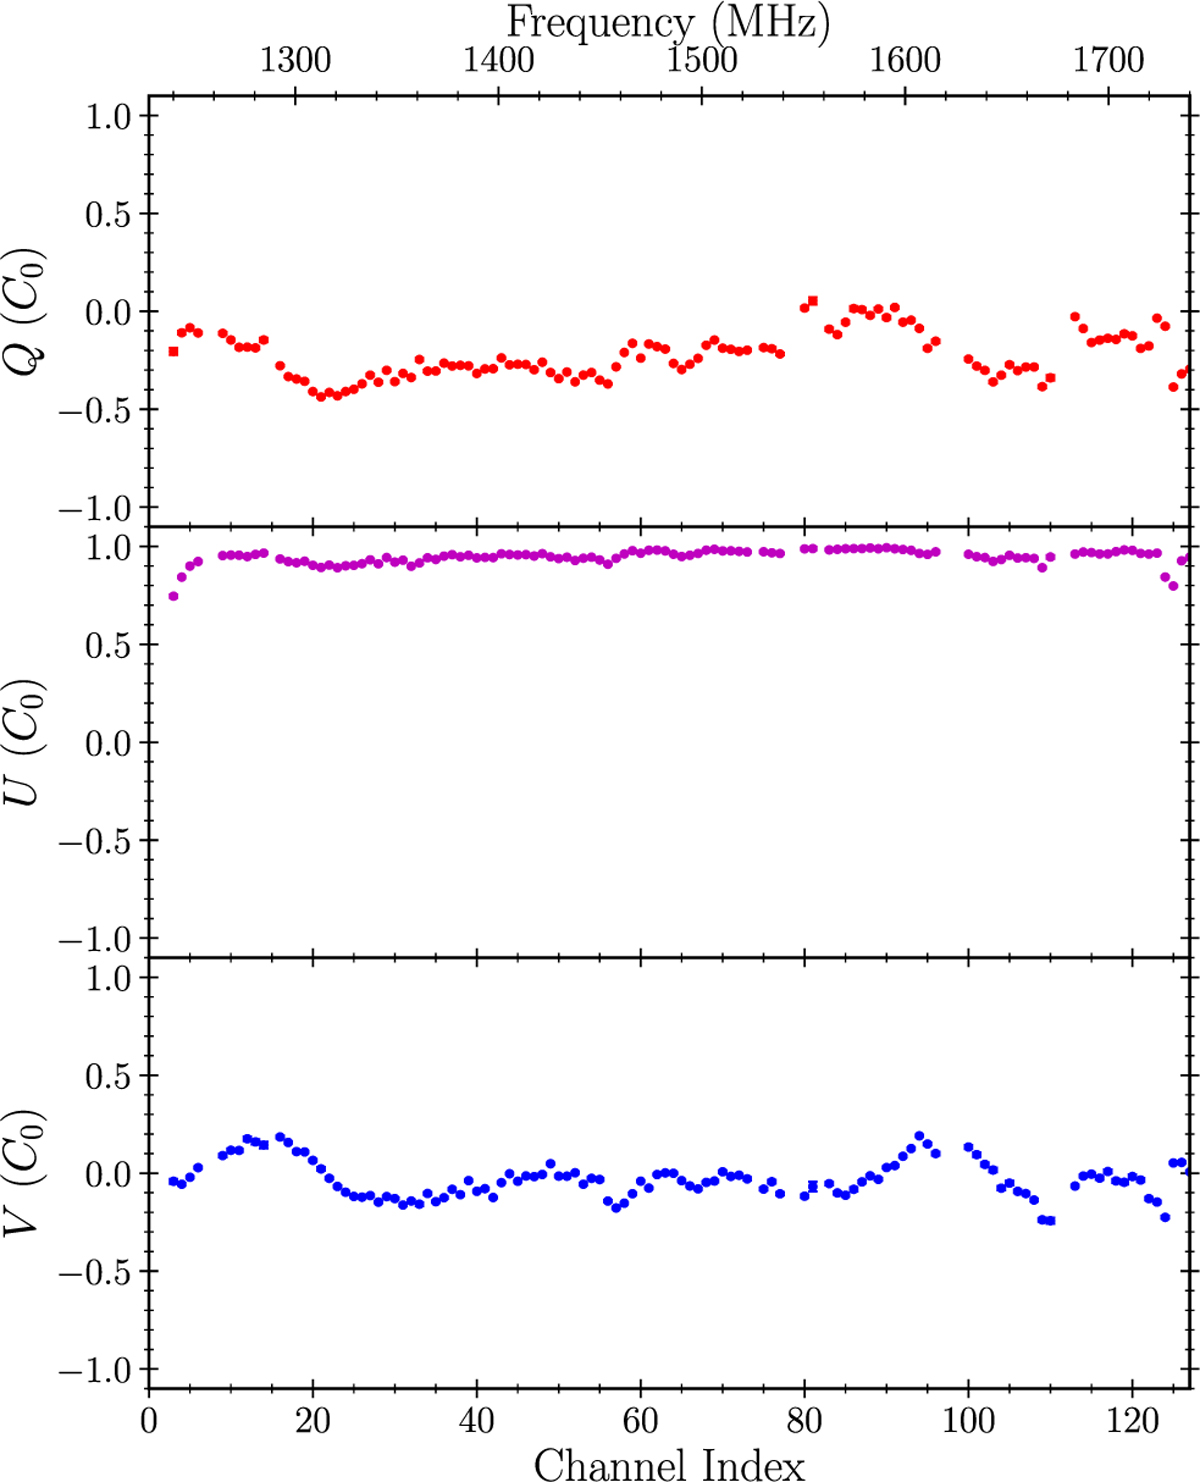
Fig. 11
Download original image
Q, U, and V Stokes parameters of the noise diode signal as a function of frequency, expressed in units of the flux density of the diode in the considered channel, C0. The results plotted in this figure were determined by analyzing the noise diode observation shown in Fig. 1, as part of the procedure for improving the calibration of NUPPI data described in Sect. 2.2.
Current usage metrics show cumulative count of Article Views (full-text article views including HTML views, PDF and ePub downloads, according to the available data) and Abstracts Views on Vision4Press platform.
Data correspond to usage on the plateform after 2015. The current usage metrics is available 48-96 hours after online publication and is updated daily on week days.
Initial download of the metrics may take a while.