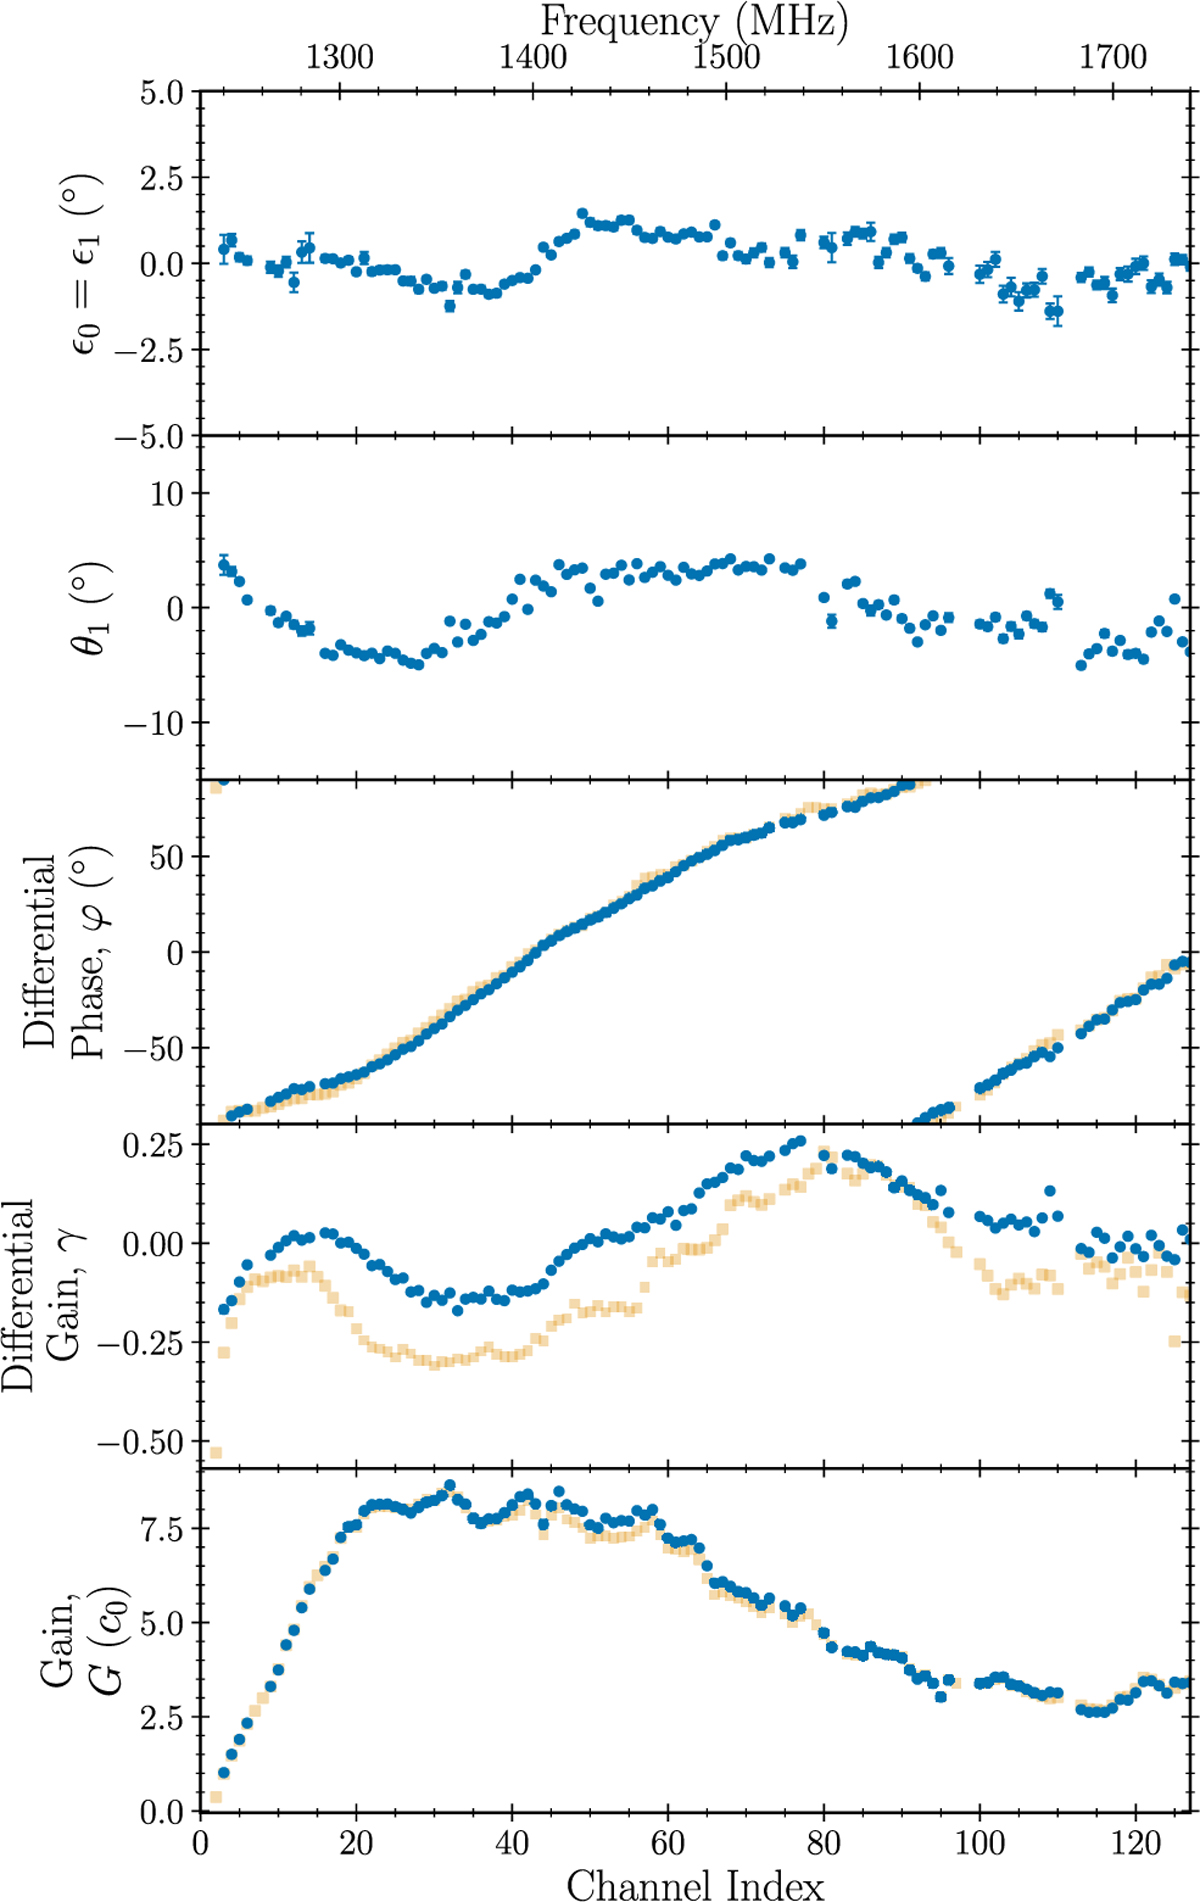
Fig. 10
Download original image
Best-fit calibration parameters as determined from a joint analysis of an observation of PSR J0742−2822 with the feed horn rotating by 180° across the ~1-h observation, and of an observation of the noise diode conducted prior to the pulsar observation. The three bottom panels are the same as in Fig. 2. The blue points represent the best-fit results from this analysis, and the yellow squares show the results from the SINGLEAXIS analysis of the noise diode observation only, as in Fig. 2, for comparison. The two top panels show the feed ellipticities (assumed to be equal in our analysis, see Sect. 2.2 for details), and the orientations (θ0 is assumed to be 0 in the analysis).
Current usage metrics show cumulative count of Article Views (full-text article views including HTML views, PDF and ePub downloads, according to the available data) and Abstracts Views on Vision4Press platform.
Data correspond to usage on the plateform after 2015. The current usage metrics is available 48-96 hours after online publication and is updated daily on week days.
Initial download of the metrics may take a while.