Fig. 1
Download original image
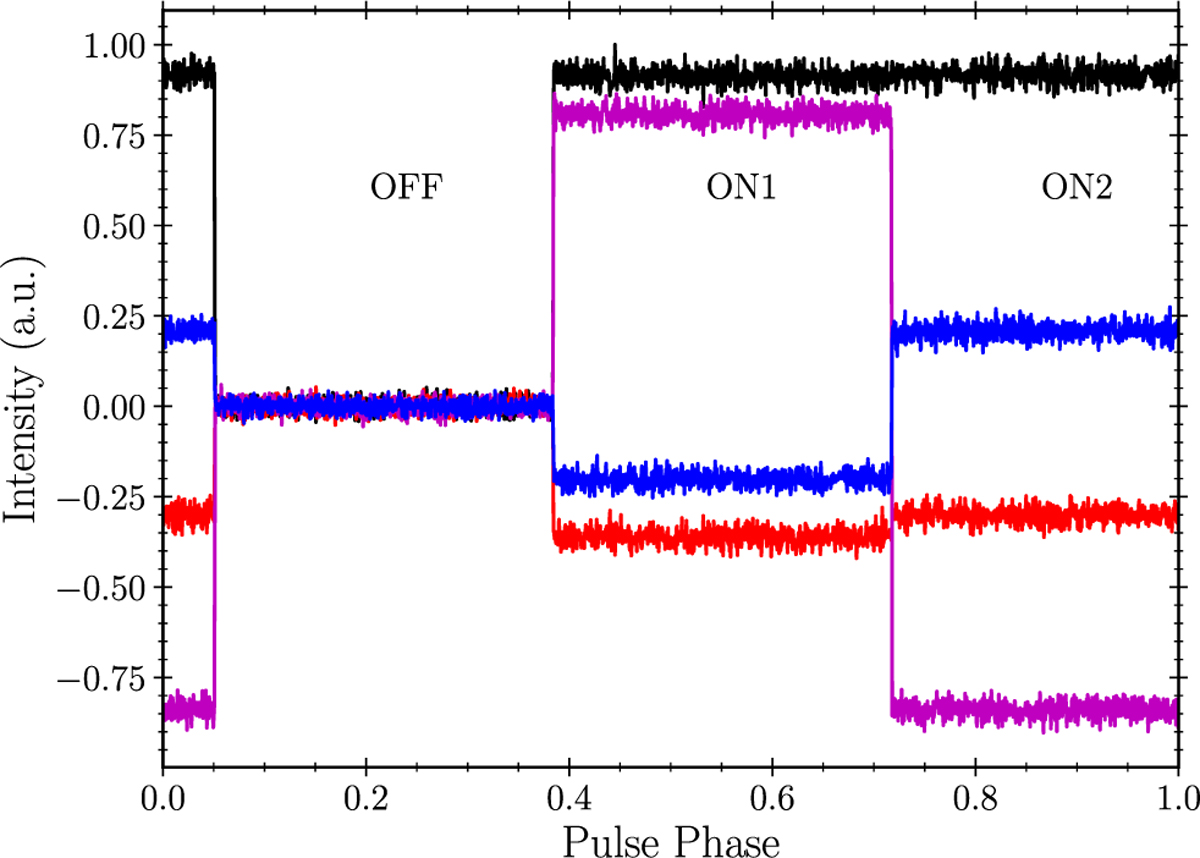
Example of a noise diode observation conducted prior to a pulsar observation with the NRT. The black line represents the total intensity, I, of the signal as a function of pulse phase (the noise diode signal is periodic, with a frequency of 3.33 Hz), and the red, magenta, and blue lines correspond respectively to the Q, U, and V Stokes parameters. Note that the I, Q, U, and V Stokes parameters are uncalibrated in this figure. The data were extracted from a 10-s observation of the noise diode with the NUPPI backend, conducted on MJD 59368 prior to an observation of PSR J0742−2822 at the central frequency of 1.484 GHz. The data shown in this figure were taken from the 46th 4-MHz channel recorded by NUPPI, corresponding to the frequency of 1.410 GHz.
Current usage metrics show cumulative count of Article Views (full-text article views including HTML views, PDF and ePub downloads, according to the available data) and Abstracts Views on Vision4Press platform.
Data correspond to usage on the plateform after 2015. The current usage metrics is available 48-96 hours after online publication and is updated daily on week days.
Initial download of the metrics may take a while.