Open Access
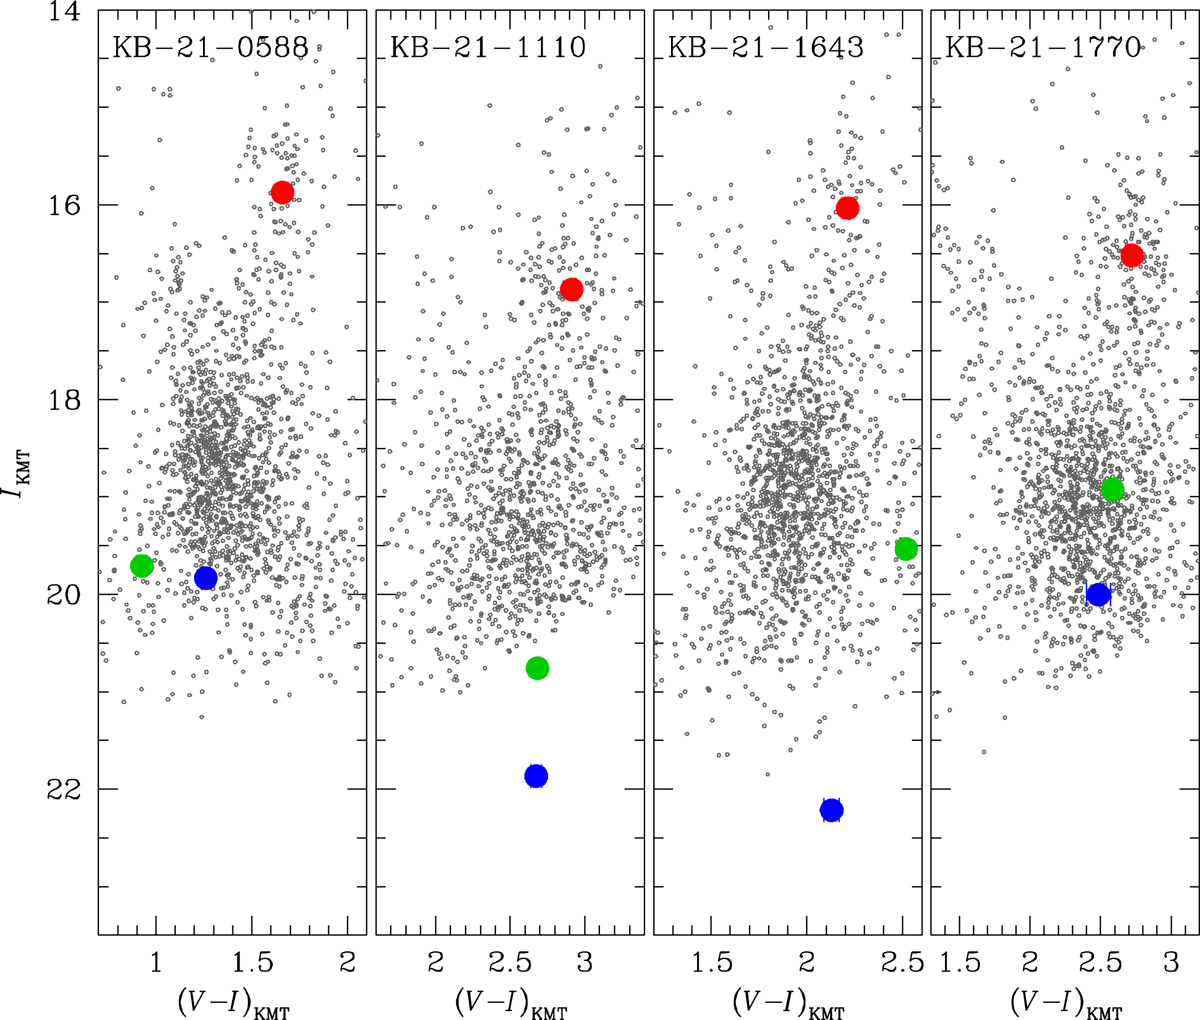
Fig. 6.
Download original image
Source positions (blue dots) in the instrumental CMDs of stars lying near the source stars of the individual events. The red and green dots in each panel represent the centroid of the red giant clump and the position of the blend, respectively.
Current usage metrics show cumulative count of Article Views (full-text article views including HTML views, PDF and ePub downloads, according to the available data) and Abstracts Views on Vision4Press platform.
Data correspond to usage on the plateform after 2015. The current usage metrics is available 48-96 hours after online publication and is updated daily on week days.
Initial download of the metrics may take a while.