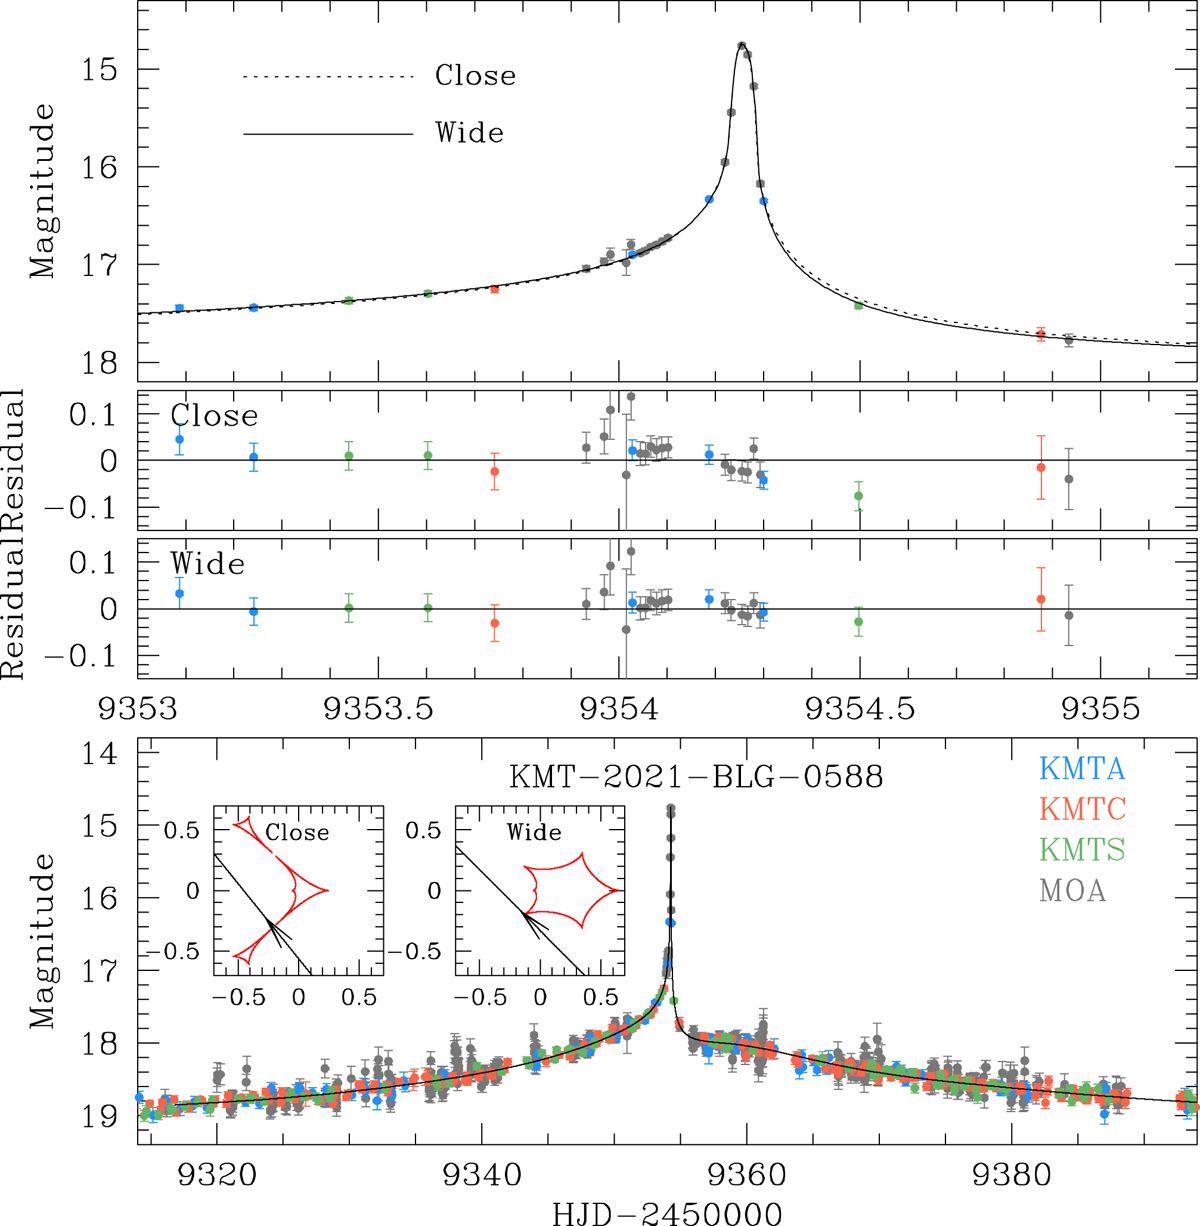
Fig. 1.
Download original image
Light curve of KMT-2021-BLG-0588. The bottom panel shows the whole view of the light curve, and the upper panels show the zoom-in view of the light curve, models, and residuals in the region around the strong peak. The dotted and solid curves drawn over the data points are the models of the close and wide solutions, respectively. The two insets in the bottom panel show the lens-system configurations of the close and wide models.
Current usage metrics show cumulative count of Article Views (full-text article views including HTML views, PDF and ePub downloads, according to the available data) and Abstracts Views on Vision4Press platform.
Data correspond to usage on the plateform after 2015. The current usage metrics is available 48-96 hours after online publication and is updated daily on week days.
Initial download of the metrics may take a while.