Fig. 8.
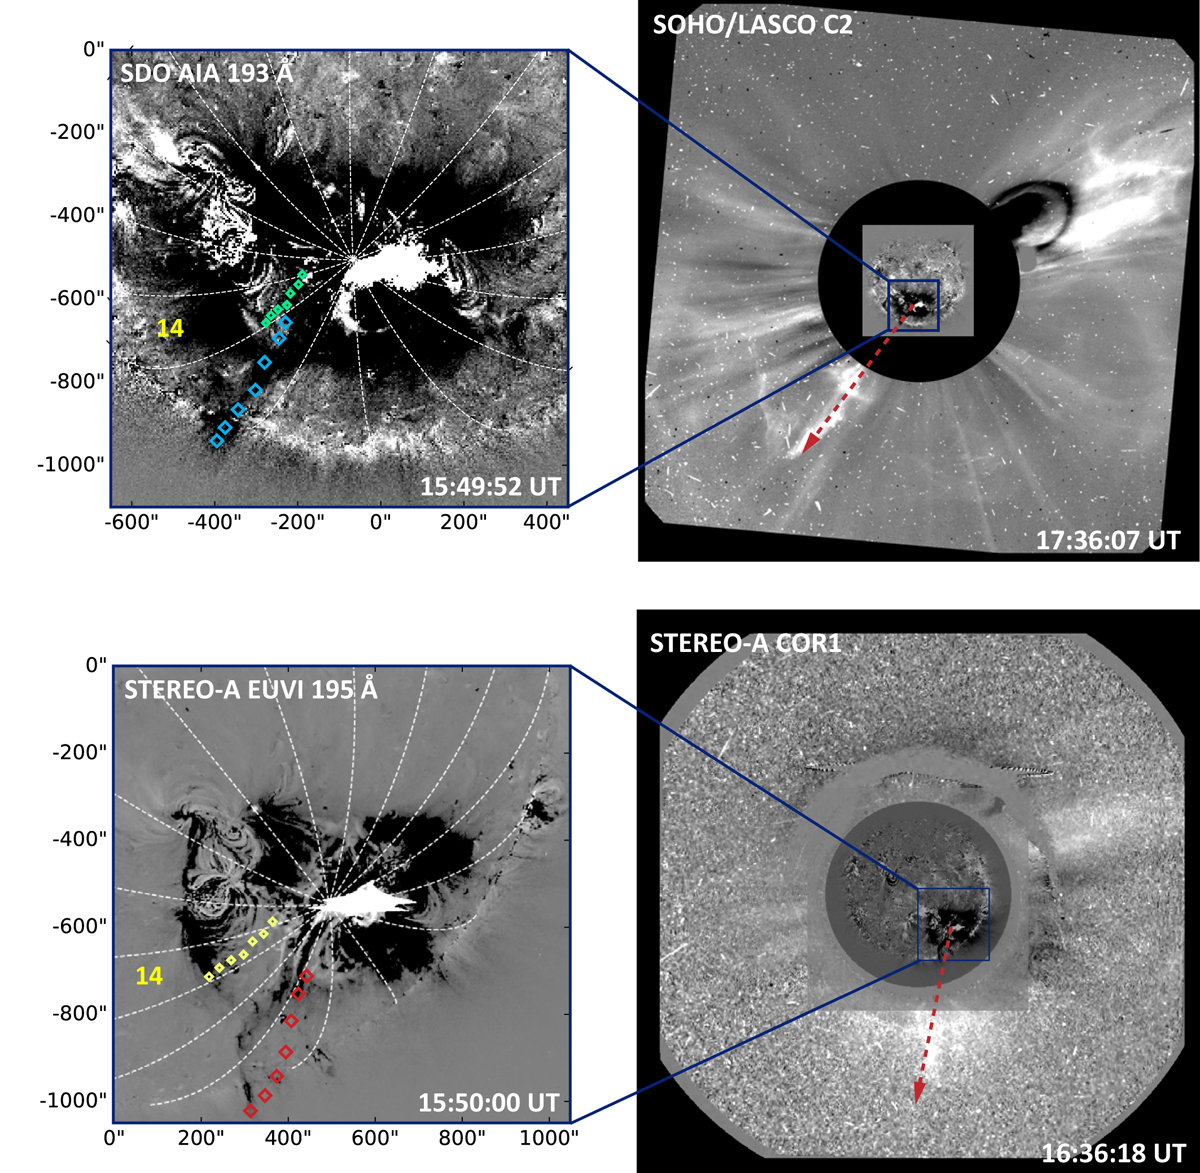
Download original image
Connection of the low coronal signatures with the CME propagation further out. Left panels: SDO AIA 193 Å and STEREO-A EUVI 195 Å base-difference images with reconstructed matching points of the eruptive filament (blue and red, respectively) and their orthogonal projections on the surface (green and yellow). The sector with the largest area of dimming is marked by its number (no. 14). Right panels: propagation of the CME seen from SOHO/LASCO C2 (top) and STEREO-A COR2 (bottom) coronagraphs at later time steps. Red arrows indicate the filament development as the bright substructure of the CME. Coronagraphic observations were obtained using JHelioviewer (Müller et al. 2017).
Current usage metrics show cumulative count of Article Views (full-text article views including HTML views, PDF and ePub downloads, according to the available data) and Abstracts Views on Vision4Press platform.
Data correspond to usage on the plateform after 2015. The current usage metrics is available 48-96 hours after online publication and is updated daily on week days.
Initial download of the metrics may take a while.