Fig. 7.
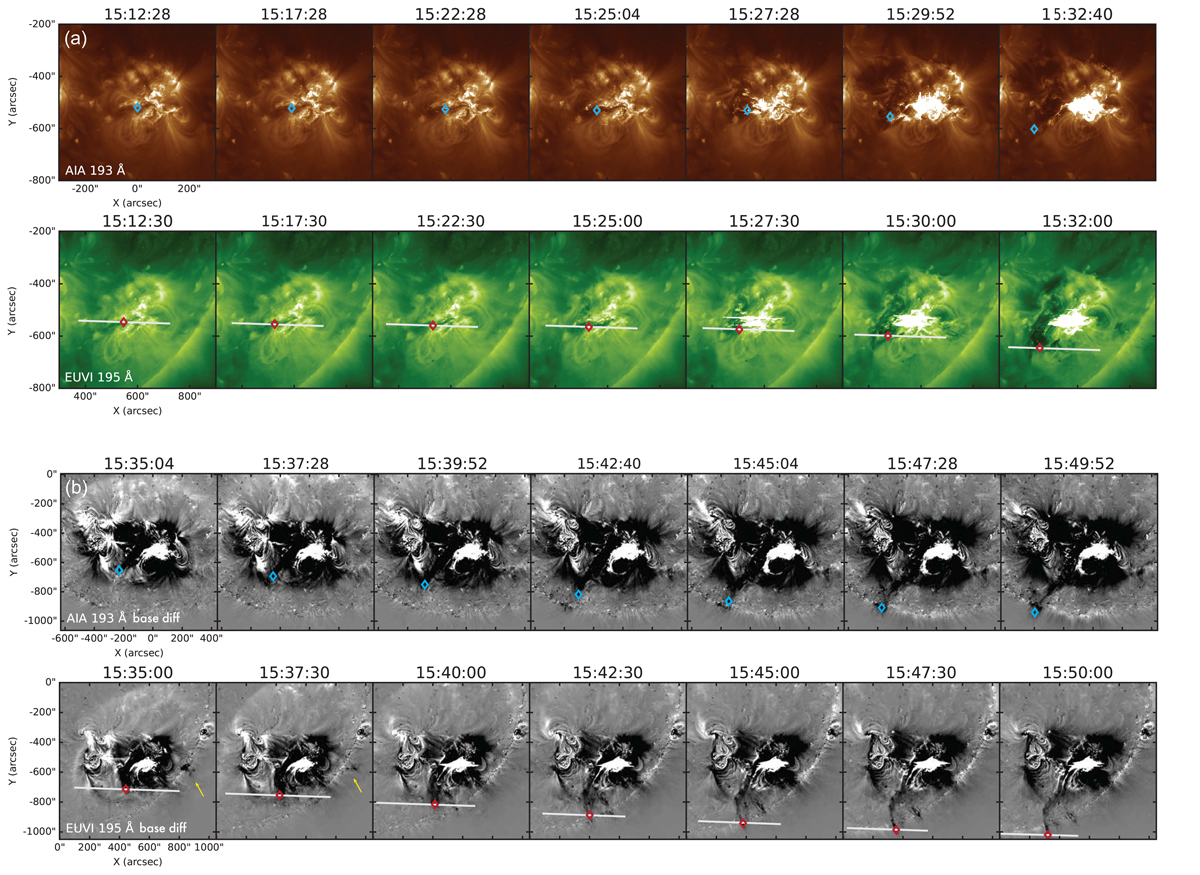
Download original image
Evolution of the erupting filament between 15:12 and 15:32 UT in SDO AIA 193 Å (top) and STEREO-A EUVI 195 Å direct images (a) and between 15:35 and 15:50 UT in base difference images (b). Blue markers show the upper tip of the filament observed by SDO AIA, and red markers indicate the matching points from the STEREO-A vantage point. Epipolar lines are shown in white. The yellow arrows indicate another, central part of the filament eruption. We note that the image scale of panels a and b is different. An animation of the reconstructions of panel b can be found in the online movie.
Current usage metrics show cumulative count of Article Views (full-text article views including HTML views, PDF and ePub downloads, according to the available data) and Abstracts Views on Vision4Press platform.
Data correspond to usage on the plateform after 2015. The current usage metrics is available 48-96 hours after online publication and is updated daily on week days.
Initial download of the metrics may take a while.