Open Access
Fig. 6.
Download original image
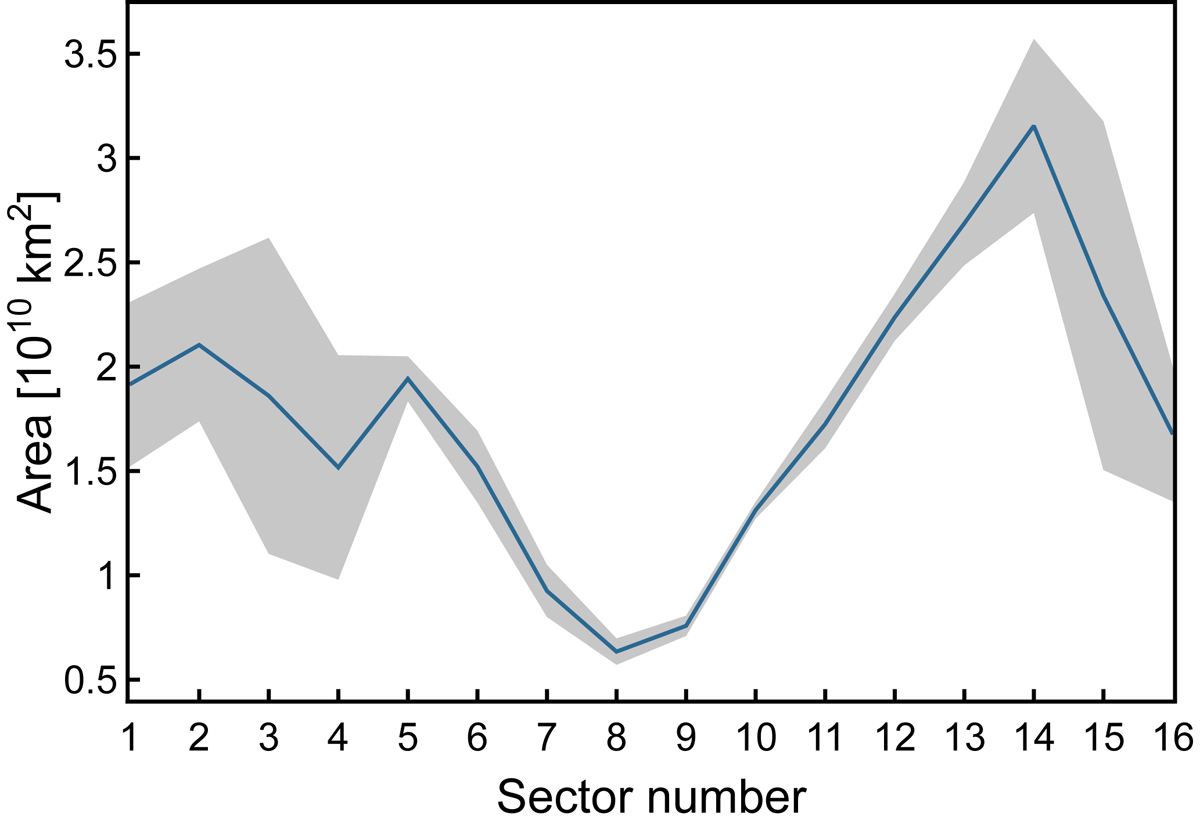
Dimming area calculated for each sector in the full cumulative map. The shaded band indicates the error estimation using different threshold levels used for the dimming segmentation. The largest dimming area is in sector no. 14.
Current usage metrics show cumulative count of Article Views (full-text article views including HTML views, PDF and ePub downloads, according to the available data) and Abstracts Views on Vision4Press platform.
Data correspond to usage on the plateform after 2015. The current usage metrics is available 48-96 hours after online publication and is updated daily on week days.
Initial download of the metrics may take a while.