Fig. 5.
Download original image
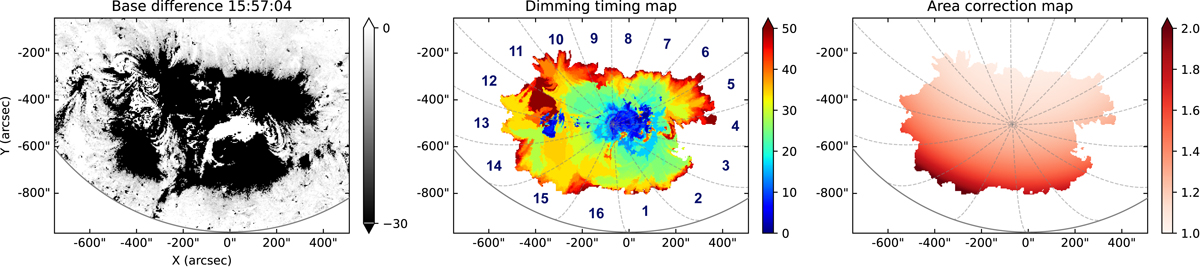
Total area of the dimming region. Left: base-difference map at the time of maximal dimming extent at 15:57 UT. Middle: cumulative timing map of the whole dimming extraction, color-coded in minutes from 15:05 UT. Right: same dimming map, but each pixel shows the ratio of its area to the area of the average pixel in the center. Dashed curves and numbers represent the chosen sectors.
Current usage metrics show cumulative count of Article Views (full-text article views including HTML views, PDF and ePub downloads, according to the available data) and Abstracts Views on Vision4Press platform.
Data correspond to usage on the plateform after 2015. The current usage metrics is available 48-96 hours after online publication and is updated daily on week days.
Initial download of the metrics may take a while.