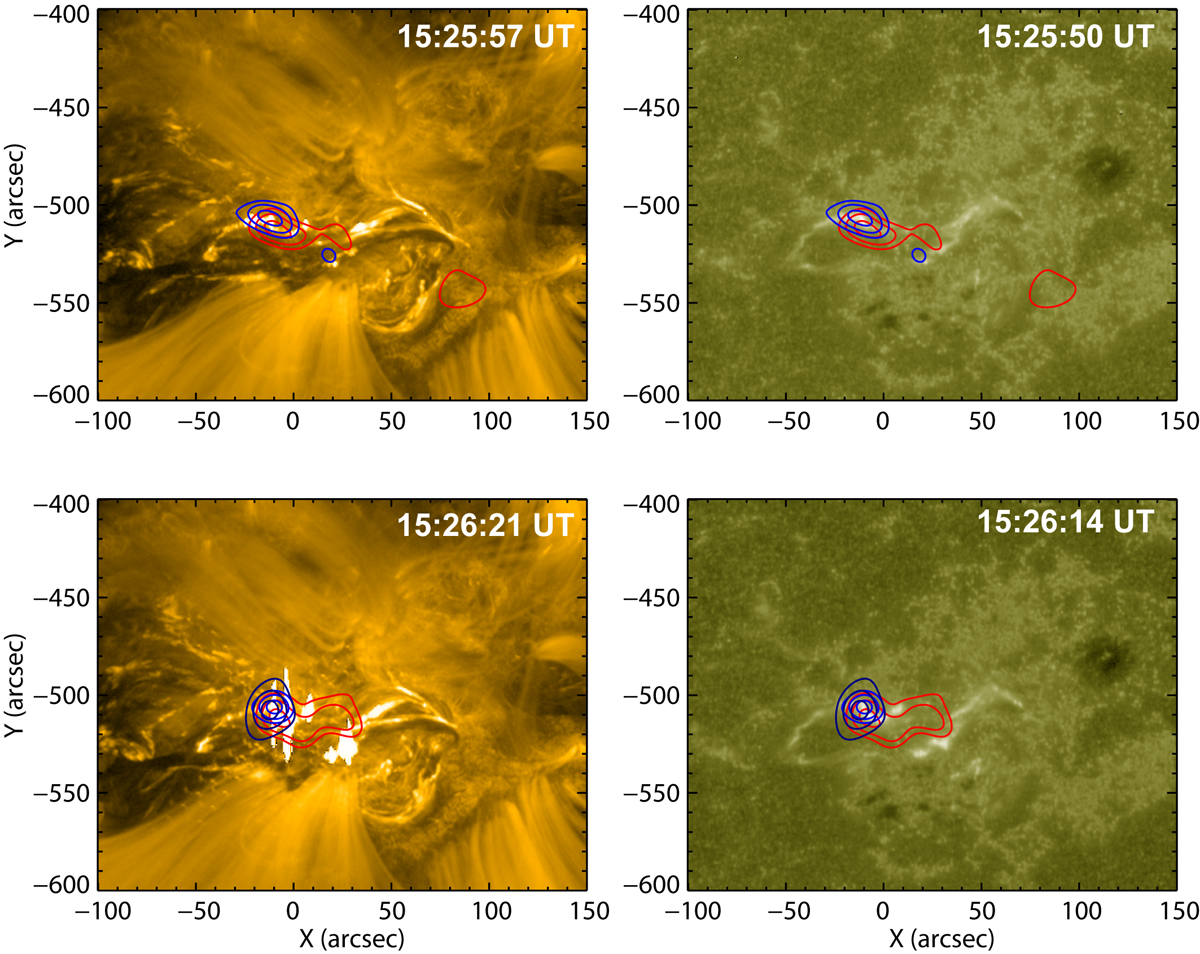
Fig. 4.
Download original image
STIX images showing 50%, 70%, and 90% contours for energy bands 4−10 keV (red), 15−25 keV (blue), and 25−50 keV (dark blue). The STIX contours are rotated to the point of view of SDO and overlaid on AIA images. The AIA images are shown for two different time steps: top row – 15:25 UT, and bottom row – 15:26 UT; and at two different AIA filters: left column – 171 Å, and right column – 1600 Å.
Current usage metrics show cumulative count of Article Views (full-text article views including HTML views, PDF and ePub downloads, according to the available data) and Abstracts Views on Vision4Press platform.
Data correspond to usage on the plateform after 2015. The current usage metrics is available 48-96 hours after online publication and is updated daily on week days.
Initial download of the metrics may take a while.