Fig. 15.
Download original image
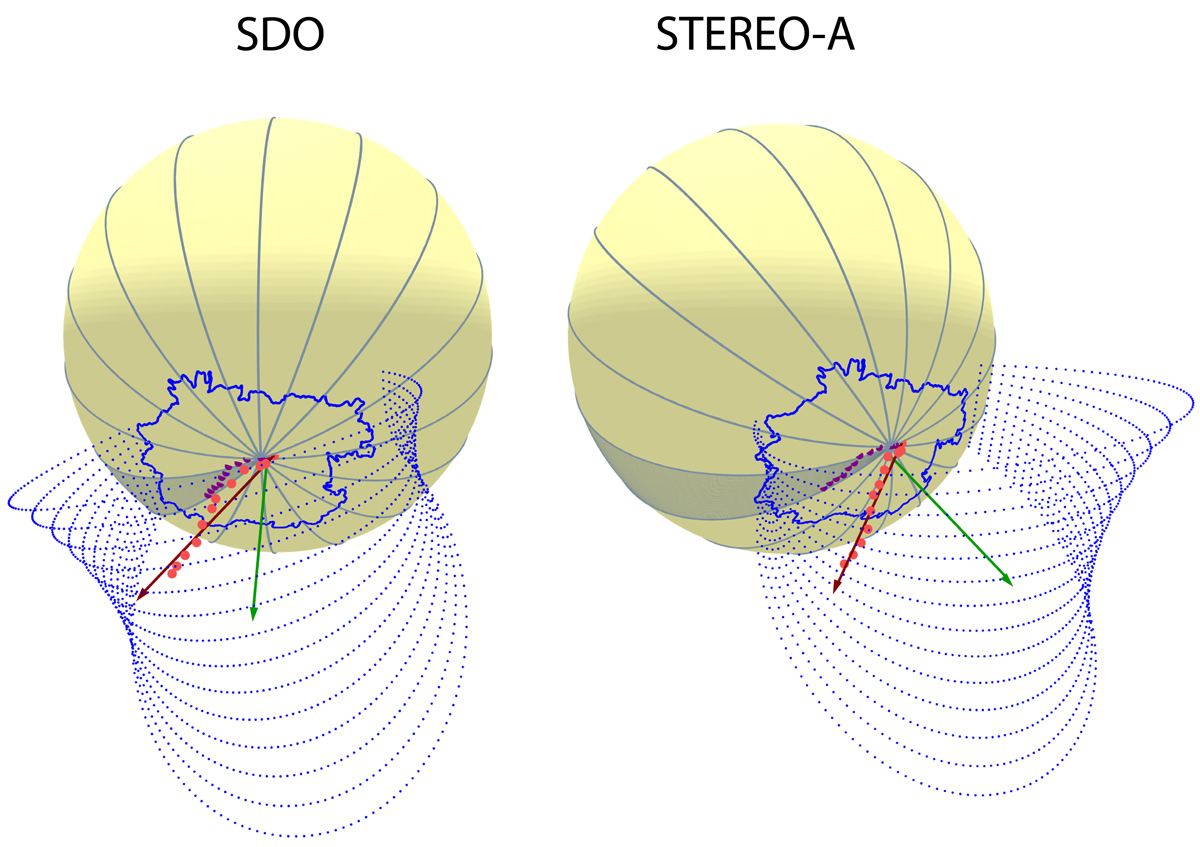
Three-dimensional model of the Sun observed from SDO (left) and STEREO-A (right). The dimming borders are shown with blue contours and the sectors are drawn as light blue lines (the filled area indicates the sector of dominant dimming propagation). Red points mark the reconstructed filament heights, and purple points are their orthogonal projections on the surface. The inner part of the GCS reconstruction is plotted as blue mesh. The dark red line presents the straight line fit to the reconstructed filament positions. The green line shows the axis of the CME, which is represented by the GCS croissant.
Current usage metrics show cumulative count of Article Views (full-text article views including HTML views, PDF and ePub downloads, according to the available data) and Abstracts Views on Vision4Press platform.
Data correspond to usage on the plateform after 2015. The current usage metrics is available 48-96 hours after online publication and is updated daily on week days.
Initial download of the metrics may take a while.