Open Access
Fig. 14.
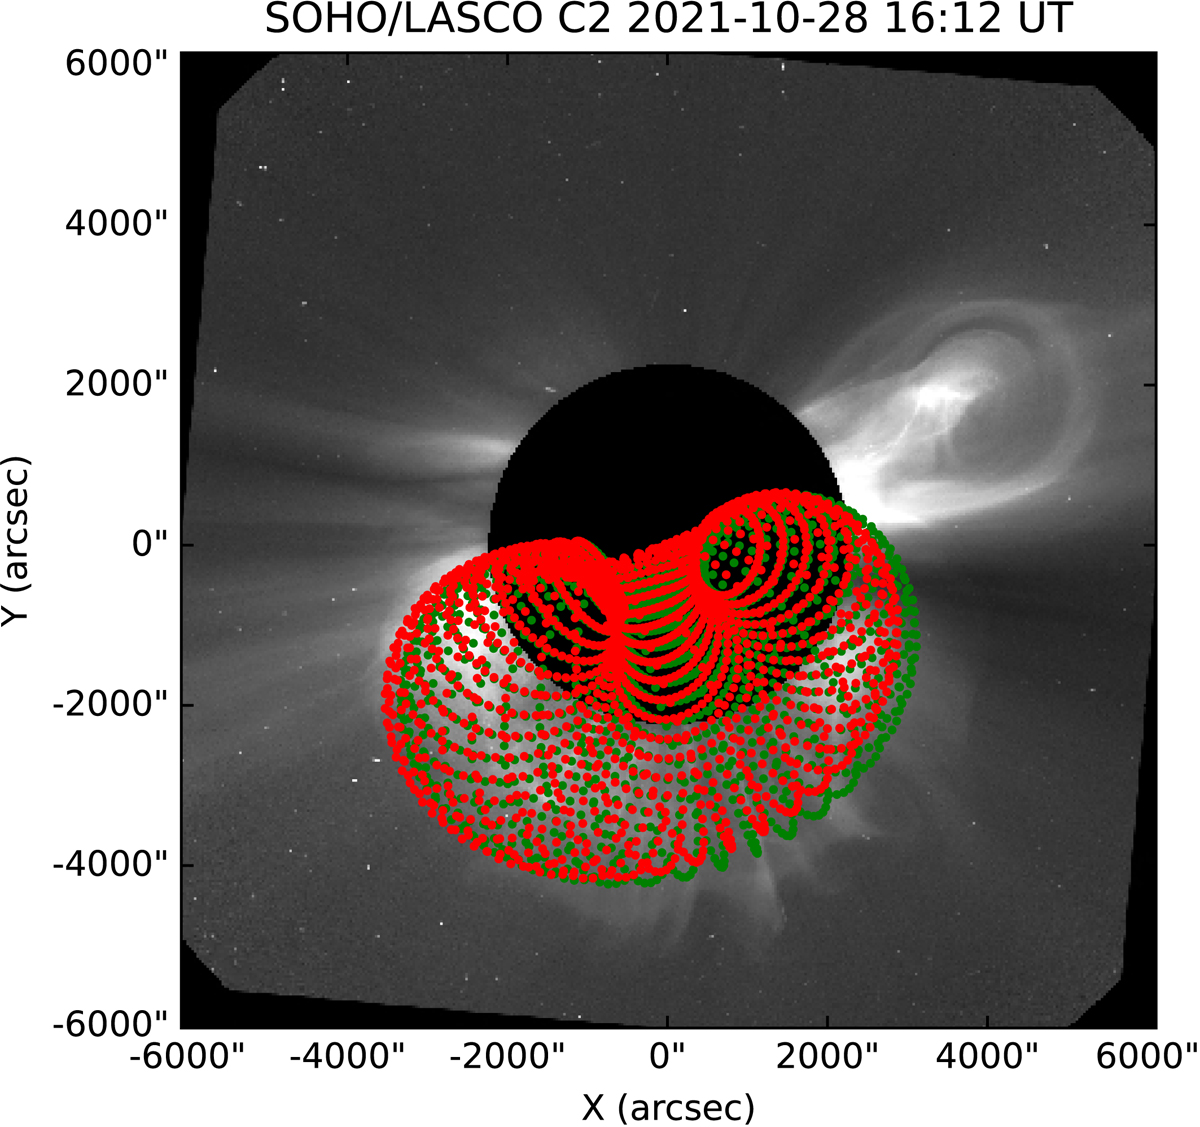
Download original image
Comparison of the two versions of the GCS reconstruction on the SOHO/LASCO C2 16:12 UT image of the CME. The green mesh represents the GCS reconstruction from coronagraph observations, and the red mesh represents the same croissant with a changed location of source chosen by the dimming center of mass.
Current usage metrics show cumulative count of Article Views (full-text article views including HTML views, PDF and ePub downloads, according to the available data) and Abstracts Views on Vision4Press platform.
Data correspond to usage on the plateform after 2015. The current usage metrics is available 48-96 hours after online publication and is updated daily on week days.
Initial download of the metrics may take a while.