Fig. 13.
Download original image
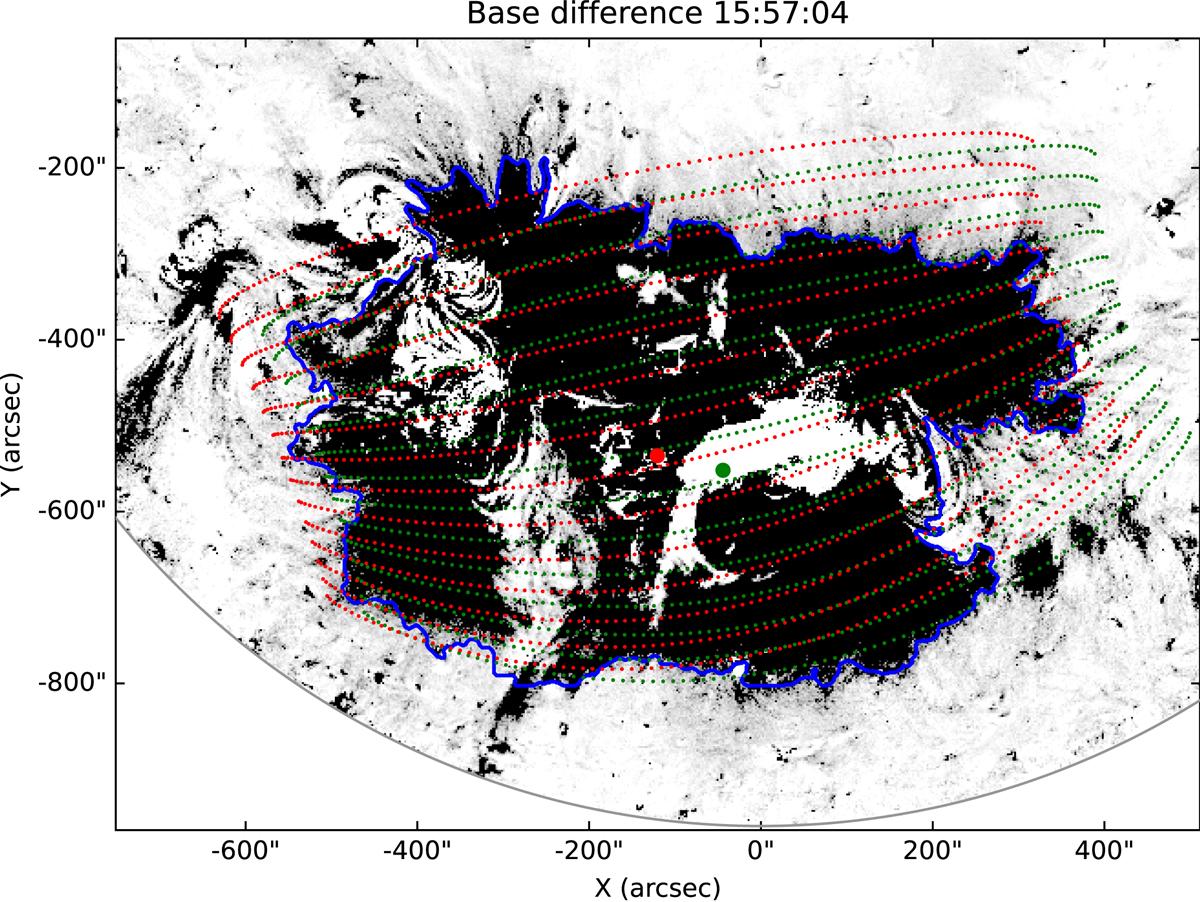
AIA 193 Å base difference image showing the dimming region (blue contour) with an overlaid orthogonal projection of the inner part of the GCS bubble (green mesh). The green marker indicates the source location derived from the GCS reconstruction, and the red marker represents the center of mass of the dimming region. The red mesh illustrates the orthogonal projection of the inner part of the GCS reconstruction, with the source point shifted to the location of the center of mass.
Current usage metrics show cumulative count of Article Views (full-text article views including HTML views, PDF and ePub downloads, according to the available data) and Abstracts Views on Vision4Press platform.
Data correspond to usage on the plateform after 2015. The current usage metrics is available 48-96 hours after online publication and is updated daily on week days.
Initial download of the metrics may take a while.