Fig. 10.
Download original image
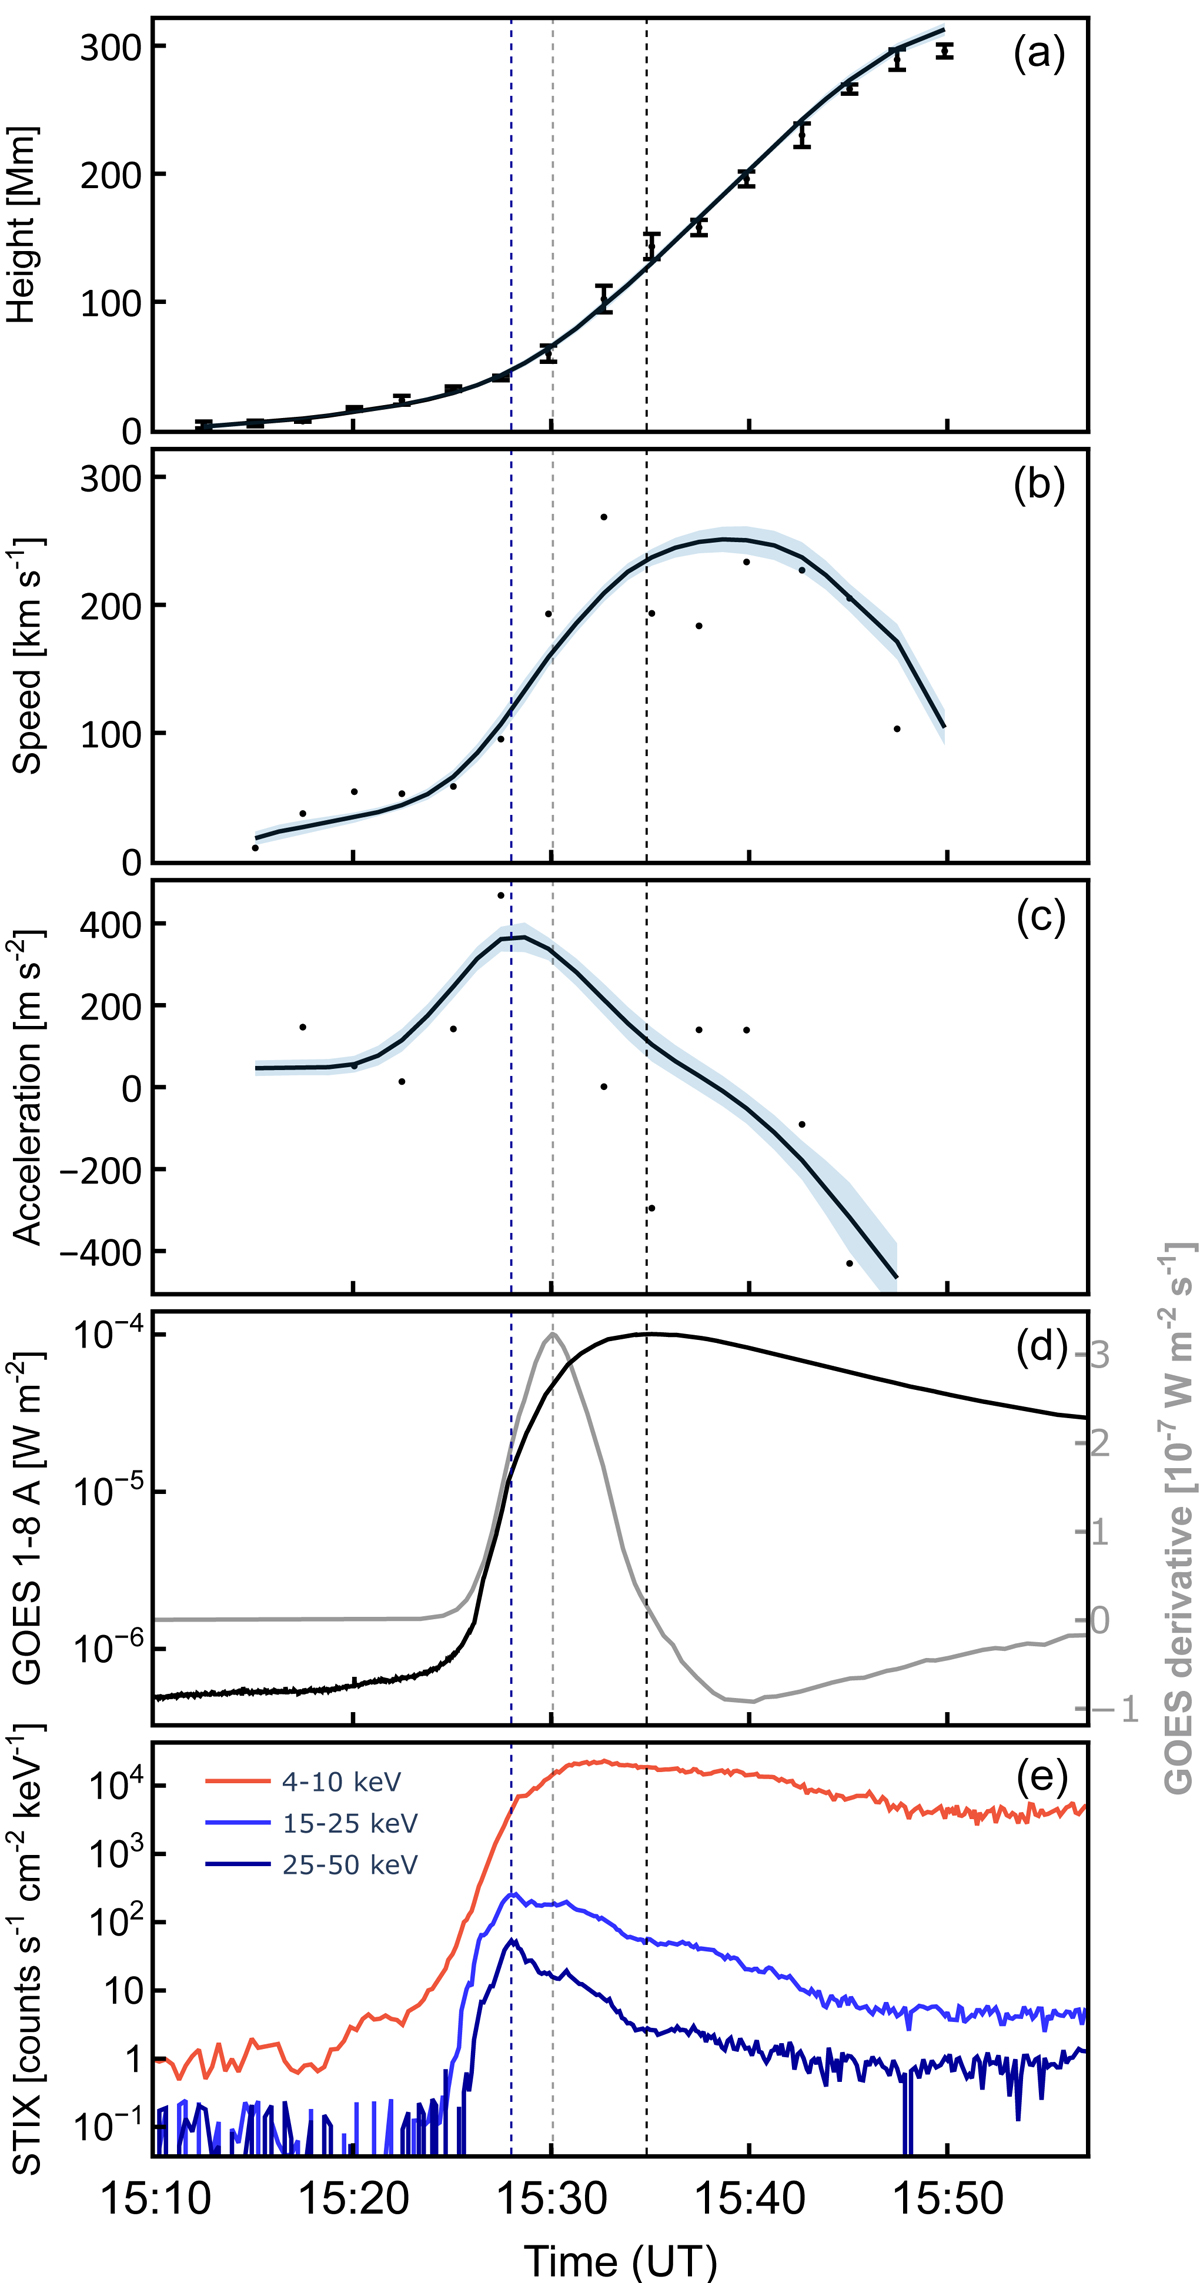
Kinematics of the erupting filament and associated SXR flare evolution. (a) Height estimations of the filament (black markers). The error bar presents the five-pixel shift in finding the matching point along the epipolar line. The corresponding black solid line indicates the smoothed height-time profile. (b) Speed and (c) acceleration of the filament obtained by numerical differentiation of height-time data (dots) and smoothed profiles (lines). The shaded areas give the error ranges. (d) GOES 1−8 Å SXR light curve (black curve, left Y-axis) and the corresponding change rate (gray curve, right Y-axis). (e) STIX count rates at 4−10 keV (red), 15−25 keV (blue), and 25−50 keV (dark blue) energies. The vertical dashed lines mark the peaks in the 25−50 keV STIX curve (dark blue), the GOES SXR flux (black), and its derivative (gray).
Current usage metrics show cumulative count of Article Views (full-text article views including HTML views, PDF and ePub downloads, according to the available data) and Abstracts Views on Vision4Press platform.
Data correspond to usage on the plateform after 2015. The current usage metrics is available 48-96 hours after online publication and is updated daily on week days.
Initial download of the metrics may take a while.