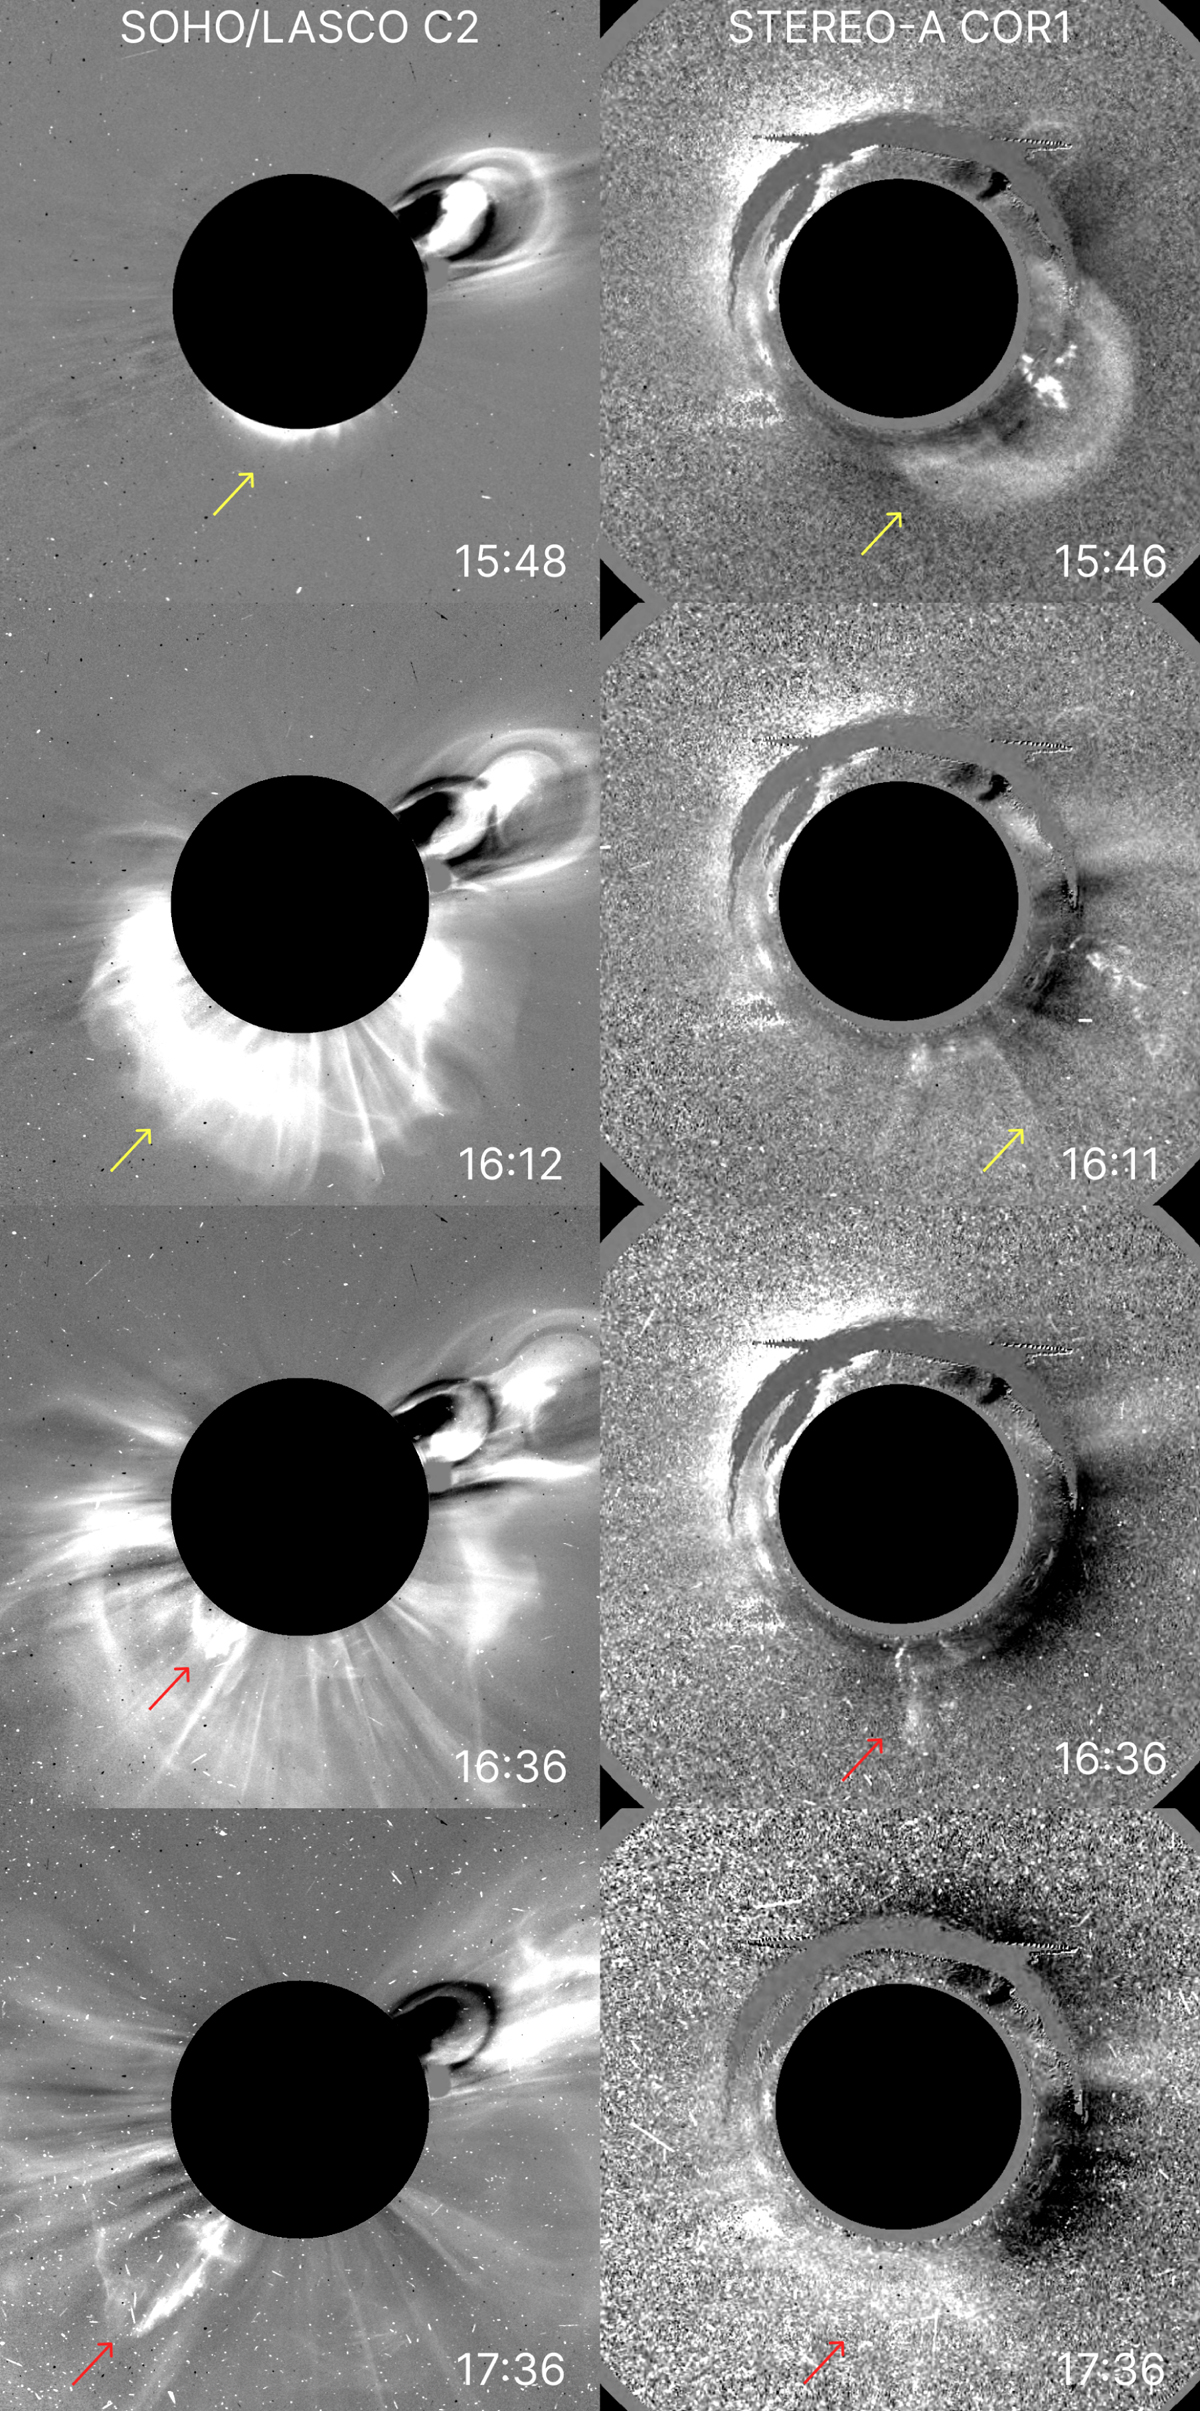
Fig. 1.
Download original image
Snapshots of coronagraphic observations using JHelioviewer (Müller et al. 2017). Left column: SOHO/LASCO C2 white-light base difference images. Right column: white-light base difference images from STEREO-A COR1. Yellow arrows indicate the CME and red arrows show the propagated leg of the filament eruption at time steps 16:36 UT and 17:36 UT, respectively.
Current usage metrics show cumulative count of Article Views (full-text article views including HTML views, PDF and ePub downloads, according to the available data) and Abstracts Views on Vision4Press platform.
Data correspond to usage on the plateform after 2015. The current usage metrics is available 48-96 hours after online publication and is updated daily on week days.
Initial download of the metrics may take a while.