Fig. 7.
Download original image
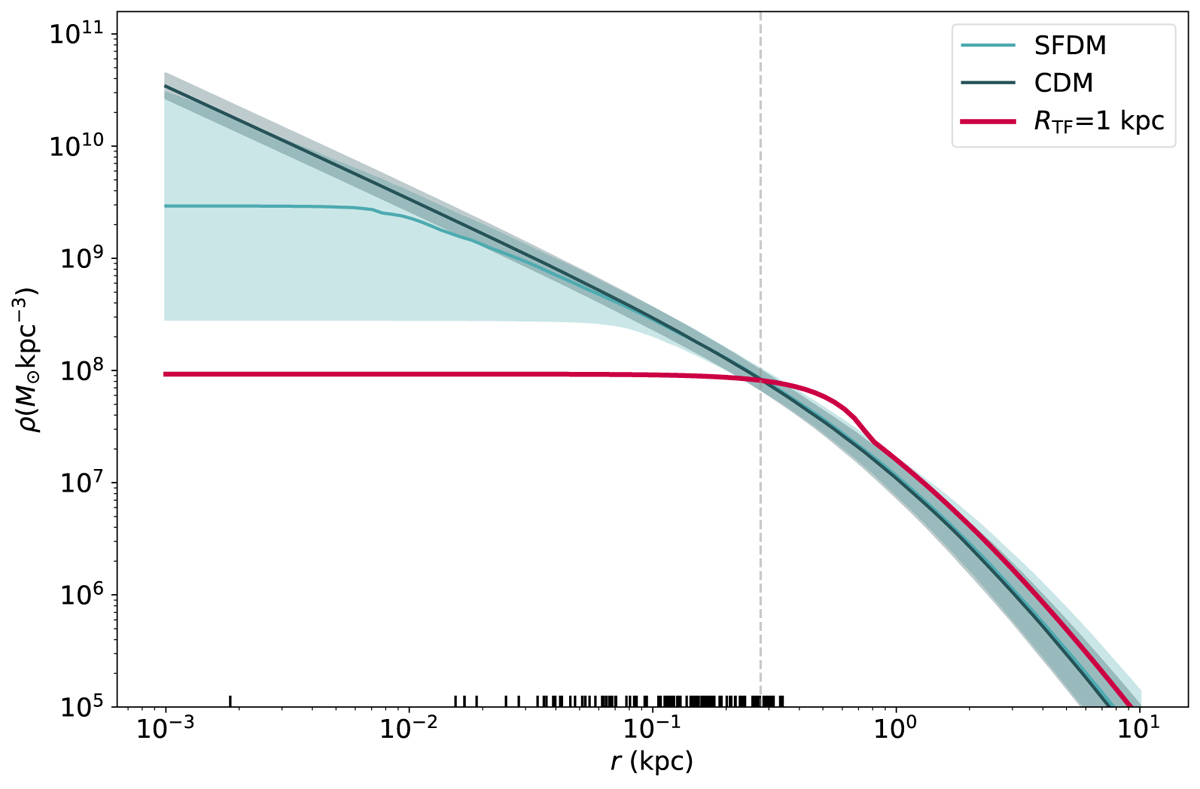
Recovered DM density profiles of Ant B for the adopted models. The solid lines represent the median density profile: the CDM model is represented in dark blue and the SFDM model in light blue. The filled areas represent the 68% confidence interval. The solid red line represents the shape of the same density profile if RTF = 1 kpc. The vertical dashed line indicates the half-light radius and the bottom marks represent the projected radii of the members of Ant B.
Current usage metrics show cumulative count of Article Views (full-text article views including HTML views, PDF and ePub downloads, according to the available data) and Abstracts Views on Vision4Press platform.
Data correspond to usage on the plateform after 2015. The current usage metrics is available 48-96 hours after online publication and is updated daily on week days.
Initial download of the metrics may take a while.