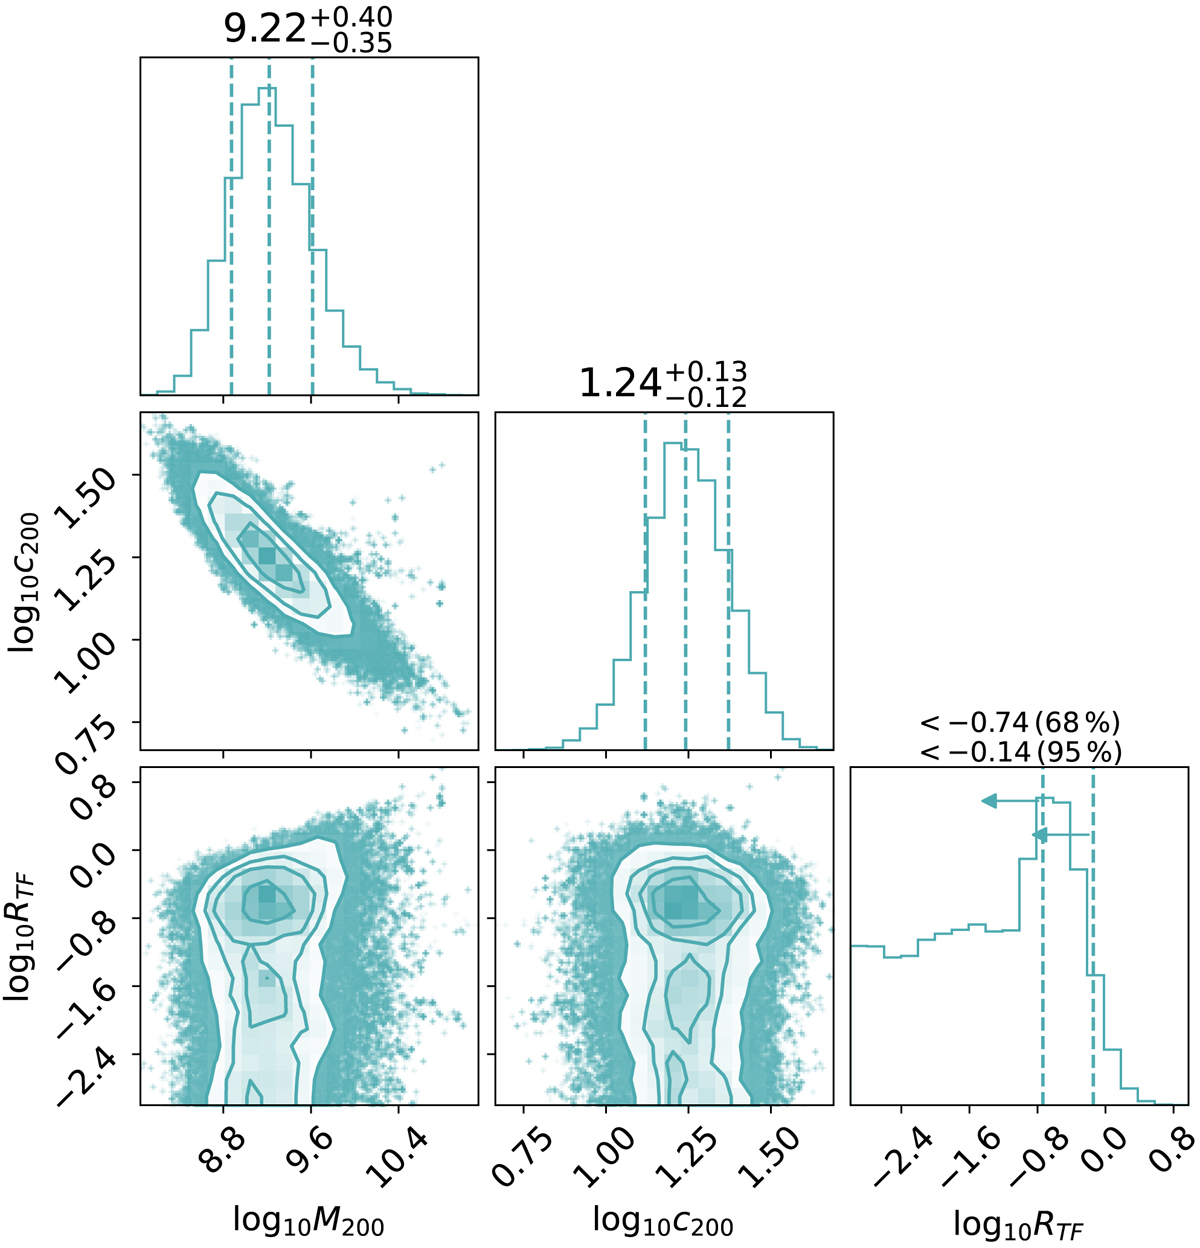
Fig. 6.
Download original image
Constraints on the SFDM profile for Ant B. The histograms along the diagonal represent the posterior distribution for each parameter: the virial mass, M200 in M⊙, the concentration parameter c200, and the characteristic length scale of the repulsive SI RTF in kpc. Their units are omitted for clarity. The vertical dashed lines indicate the median and 68% confidence interval (without arrows) and the 68% and 95% confidence limits (upper and lower arrows, respectively). The other panels represent the 2D posterior distributions of these parameters, with the contours corresponding to the 0.5σ, 1σ, 1.5σ, and 2σ confidence levels, where σ is the standard deviation of the 2D distribution.
Current usage metrics show cumulative count of Article Views (full-text article views including HTML views, PDF and ePub downloads, according to the available data) and Abstracts Views on Vision4Press platform.
Data correspond to usage on the plateform after 2015. The current usage metrics is available 48-96 hours after online publication and is updated daily on week days.
Initial download of the metrics may take a while.