Fig. 4.
Download original image
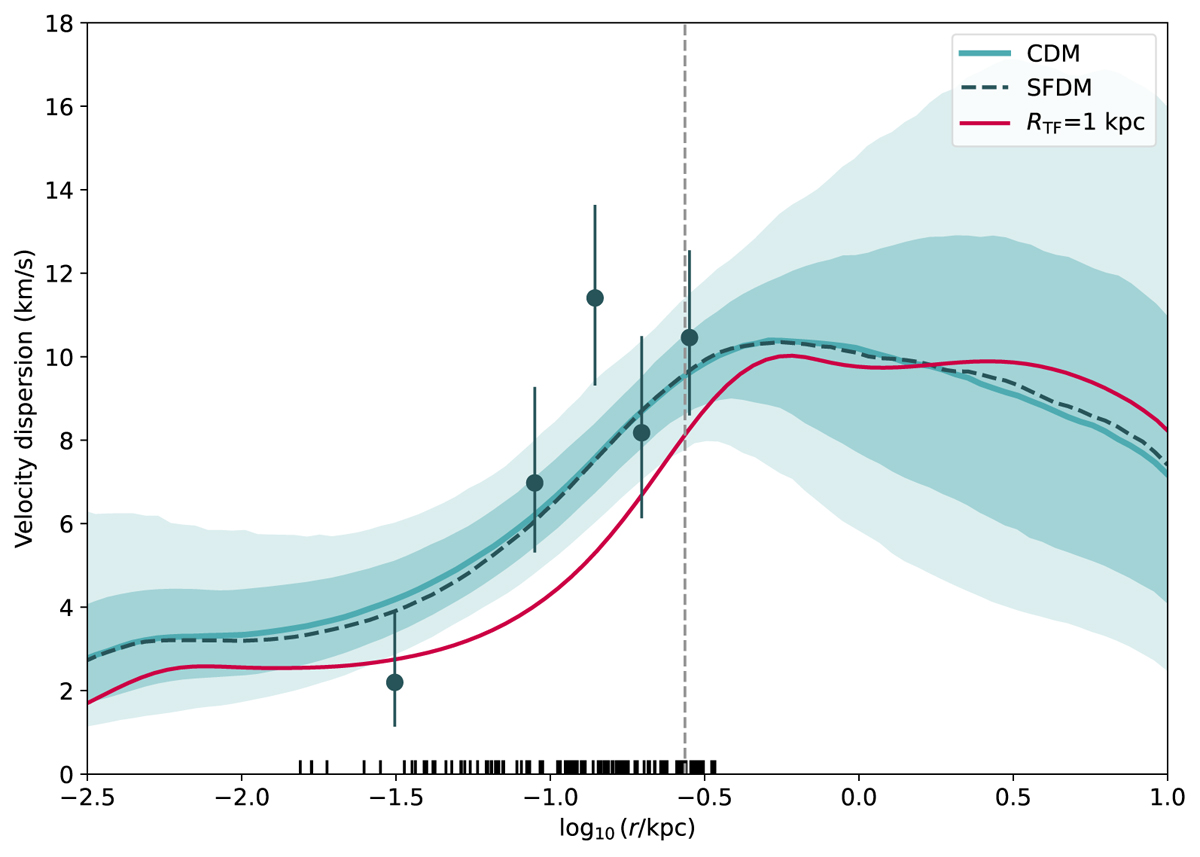
Velocity dispersion of Ant B. The dark blue points represent the binned velocity dispersion with the associated uncertainties. The best fit from GRAVSPHERE for the CDM model is shown as a solid light blue line, with the light blue shaded regions showing the 68% and 95% confidence intervals for the CDM model. The dashed dark blue line represents the best fit for the SFDM model. Since the best fit for both models is so similar, the confidence intervals for the SFDM model are omitted for clarity. The half-light radius is represented by the vertical dashed line and the bottom marks represent the projected radii of the members of Ant B. The solid red line represents the shape that the velocity dispersion would have if RTF = 1 kpc, keeping the other parameters with the same values as the best fit for the SFDM profile.
Current usage metrics show cumulative count of Article Views (full-text article views including HTML views, PDF and ePub downloads, according to the available data) and Abstracts Views on Vision4Press platform.
Data correspond to usage on the plateform after 2015. The current usage metrics is available 48-96 hours after online publication and is updated daily on week days.
Initial download of the metrics may take a while.