Fig. 3.
Download original image
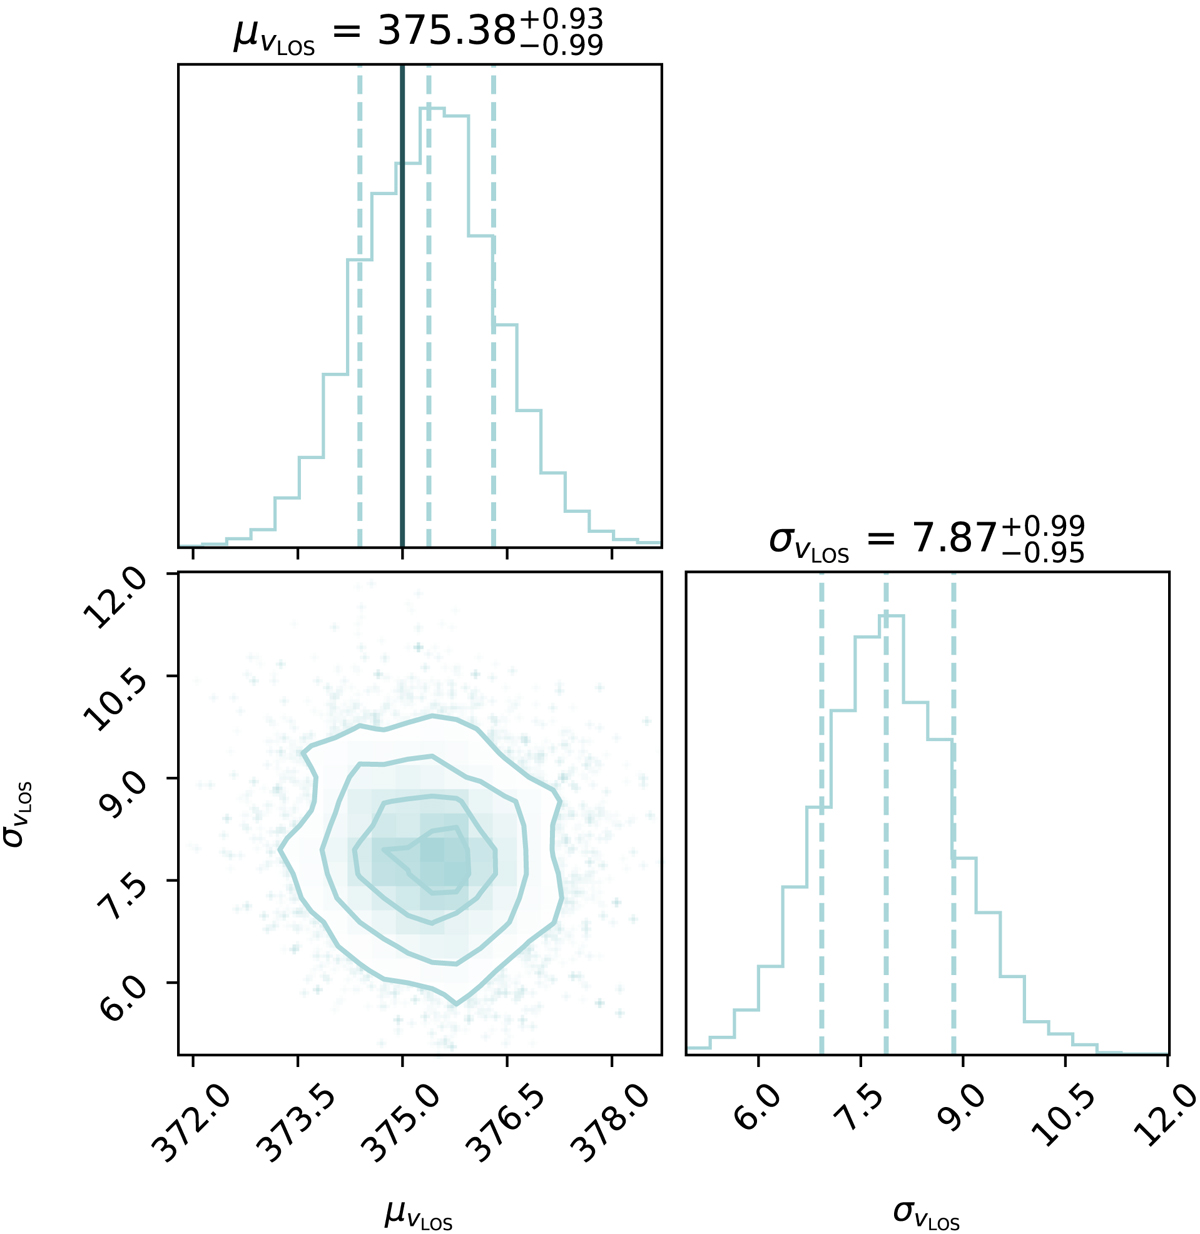
Corner plot for the MCMC velocity fit, using the 127 member stars of Ant B. The histograms along the diagonal represent the posterior distribution for each parameter: the mean value μU in the top panel and the dispersion σU in the bottom right. The vertical dashed lines indicate the median and 68% confidence interval. The bottom-left panel represents the 2D posterior distributions of both of these parameters, with the contours corresponding to 0.5σ, 1σ, 1.5σ, and 2σ confidence levels, where σ is the standard deviation of the 2D distribution. The solid dark blue line in the top panel indicates the mean velocity of the H I gas reported by Sand et al. (2015).
Current usage metrics show cumulative count of Article Views (full-text article views including HTML views, PDF and ePub downloads, according to the available data) and Abstracts Views on Vision4Press platform.
Data correspond to usage on the plateform after 2015. The current usage metrics is available 48-96 hours after online publication and is updated daily on week days.
Initial download of the metrics may take a while.