Open Access
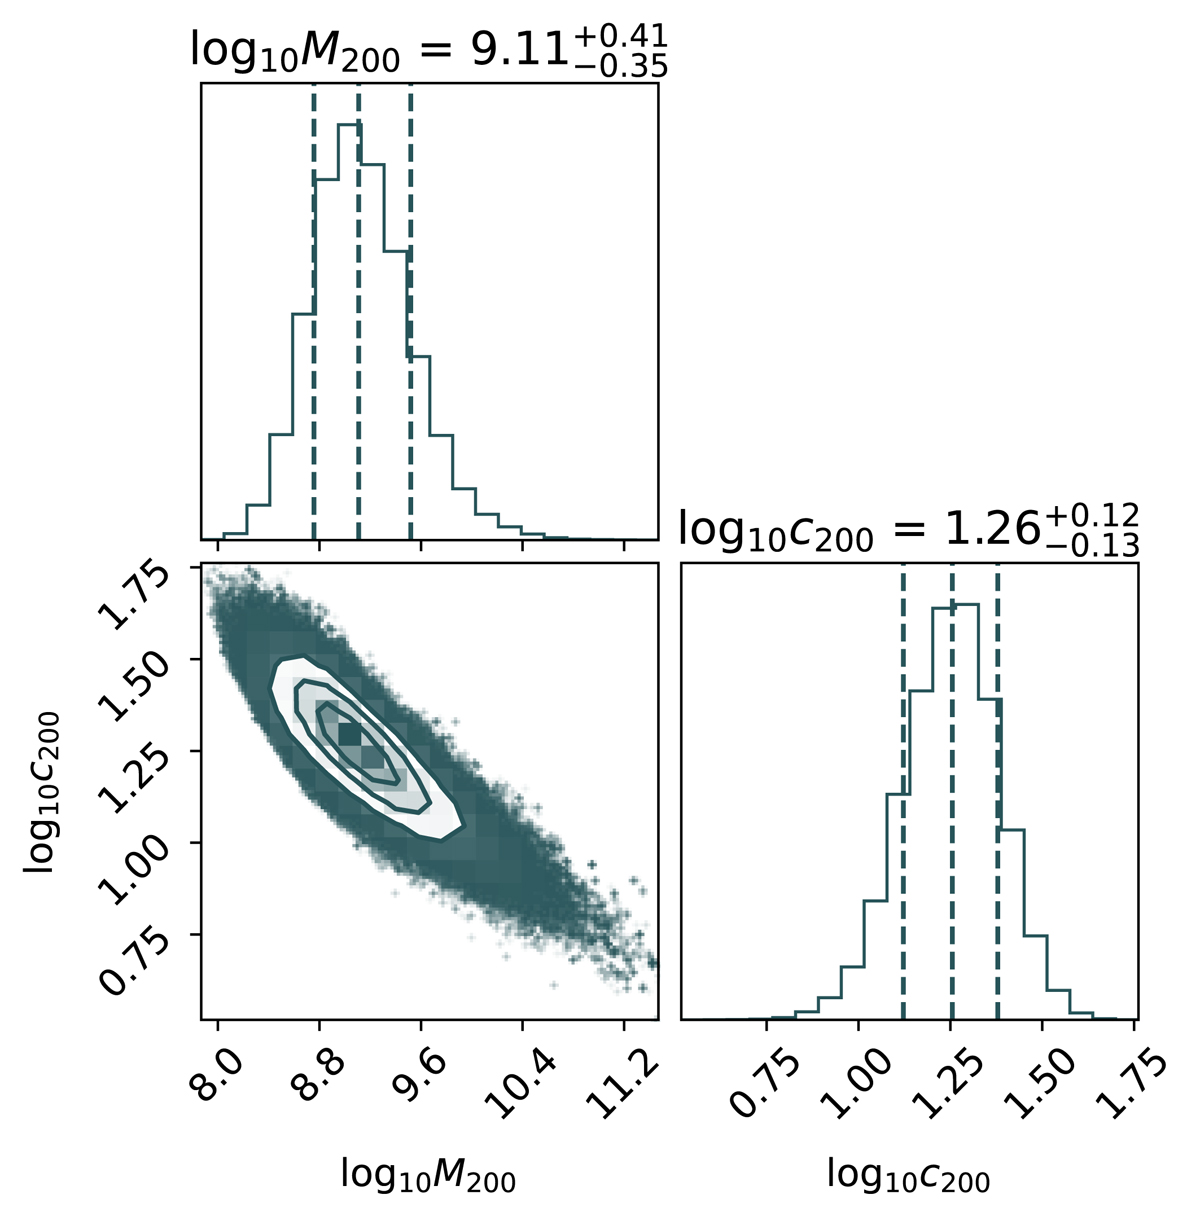
Fig. C.4.
Download original image
Constraints on the CDM profile for Ant B after changing the coordinates of the centre. The histograms along the diagonal represent the posterior distribution for each parameter: the virial mass, M200 in M⊙, and the concentration parameter, c200.
Current usage metrics show cumulative count of Article Views (full-text article views including HTML views, PDF and ePub downloads, according to the available data) and Abstracts Views on Vision4Press platform.
Data correspond to usage on the plateform after 2015. The current usage metrics is available 48-96 hours after online publication and is updated daily on week days.
Initial download of the metrics may take a while.