Open Access
Fig. C.1.
Download original image
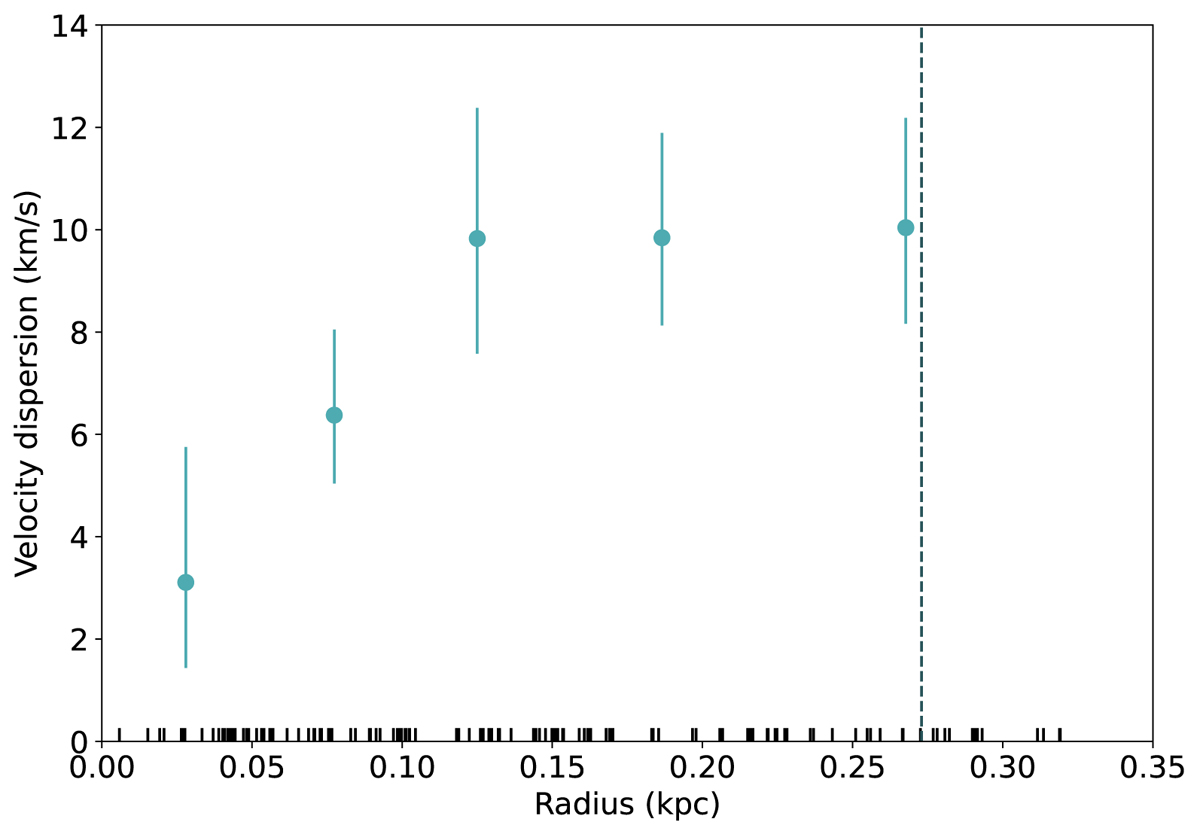
Velocity dispersion for each bin along with associated uncertainties after changing the coordinates of the centre of Ant B. The vertical dashed line indicates the half-light radius and the bottom marks represent the projected radii of the members of Ant B.
Current usage metrics show cumulative count of Article Views (full-text article views including HTML views, PDF and ePub downloads, according to the available data) and Abstracts Views on Vision4Press platform.
Data correspond to usage on the plateform after 2015. The current usage metrics is available 48-96 hours after online publication and is updated daily on week days.
Initial download of the metrics may take a while.