Open Access
Fig. 1.
Download original image
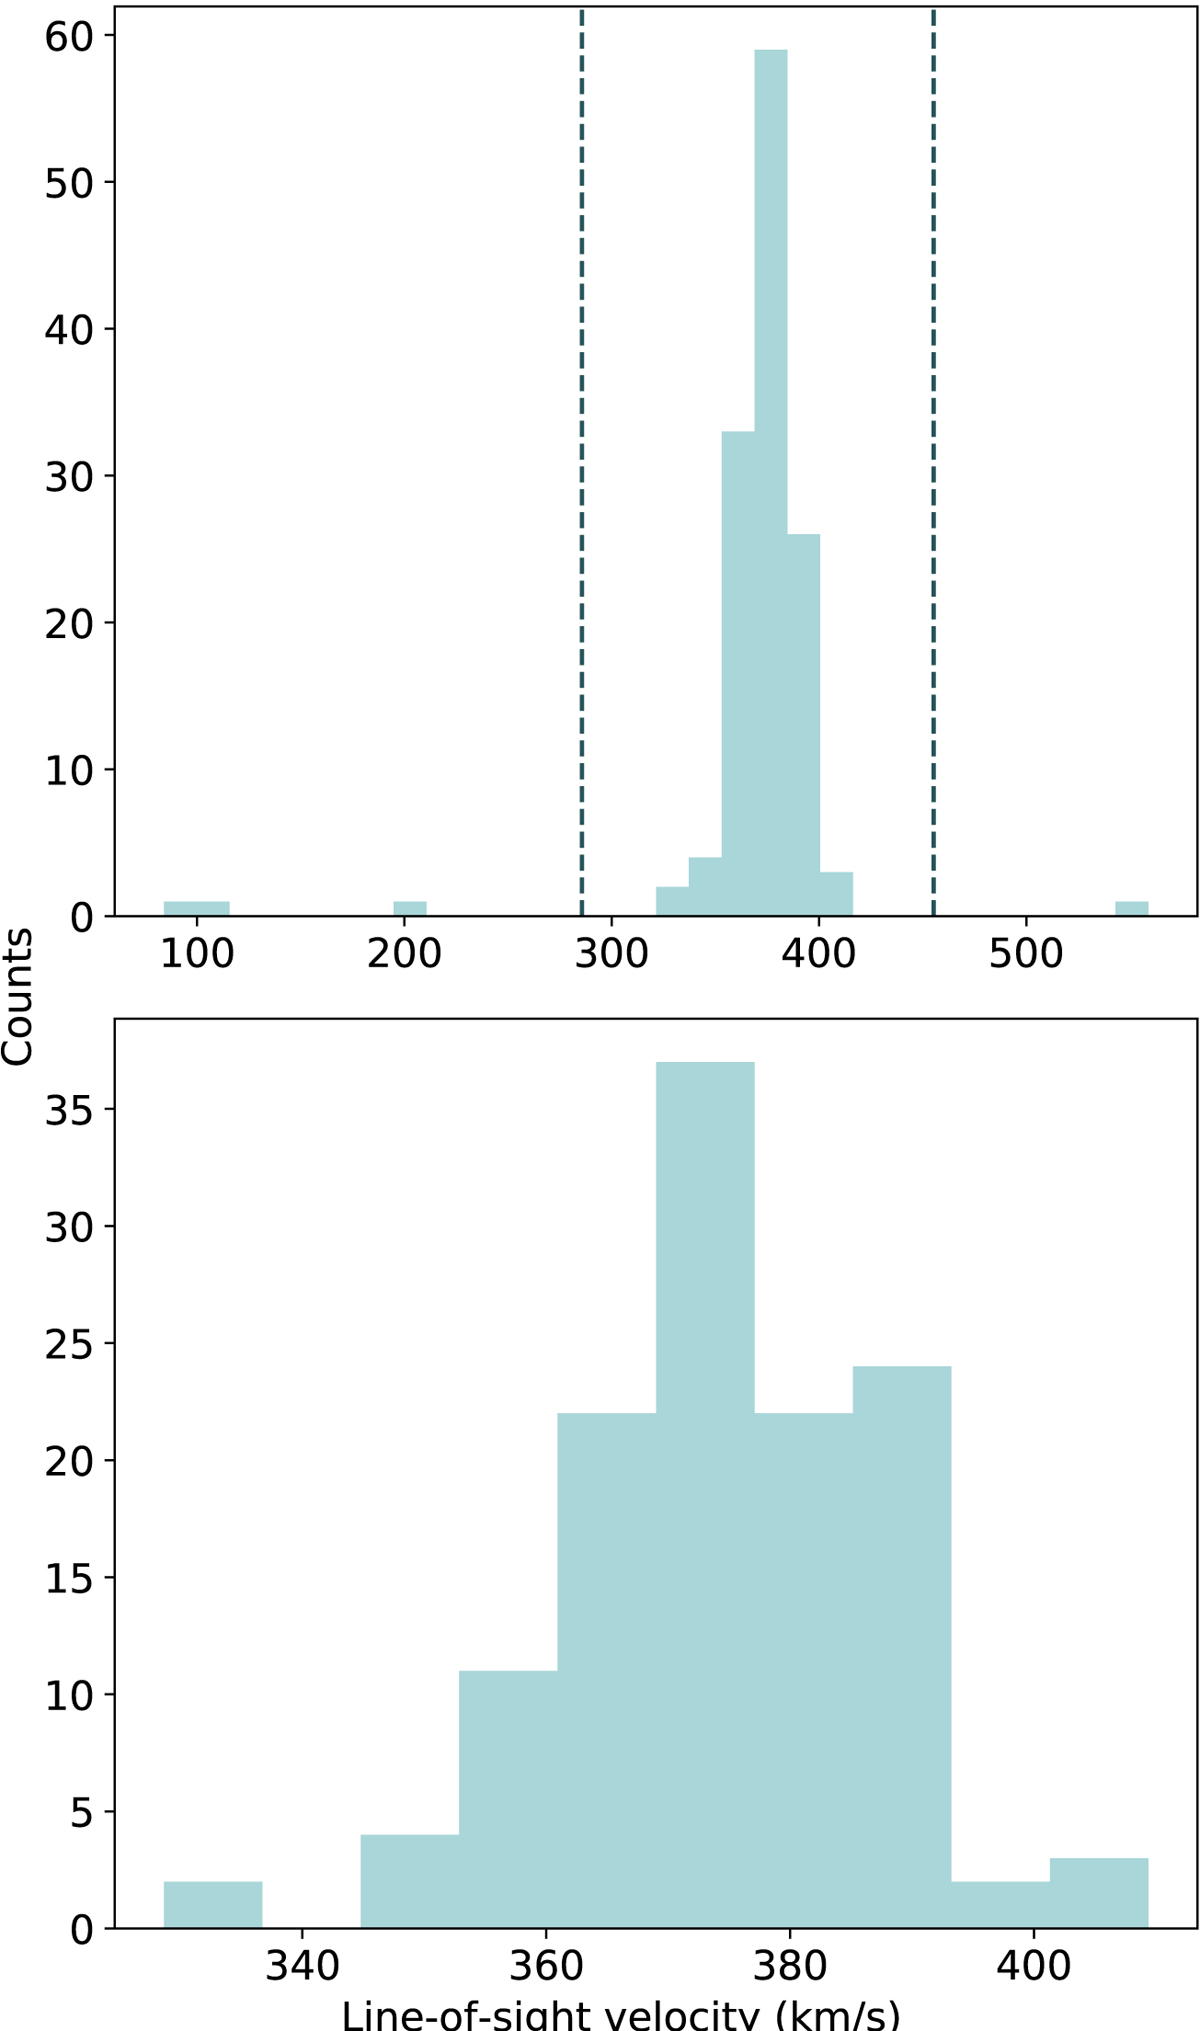
Histogram of the line-of-sight velocity for Ant B candidates. Top: all the candidates for which we have spectra (131 stars), with the velocity cut, v = μ ± 2σ, represented by the dashed lines. Bottom: after the velocity cut (127 stars).
Current usage metrics show cumulative count of Article Views (full-text article views including HTML views, PDF and ePub downloads, according to the available data) and Abstracts Views on Vision4Press platform.
Data correspond to usage on the plateform after 2015. The current usage metrics is available 48-96 hours after online publication and is updated daily on week days.
Initial download of the metrics may take a while.