Fig. 9
Download original image
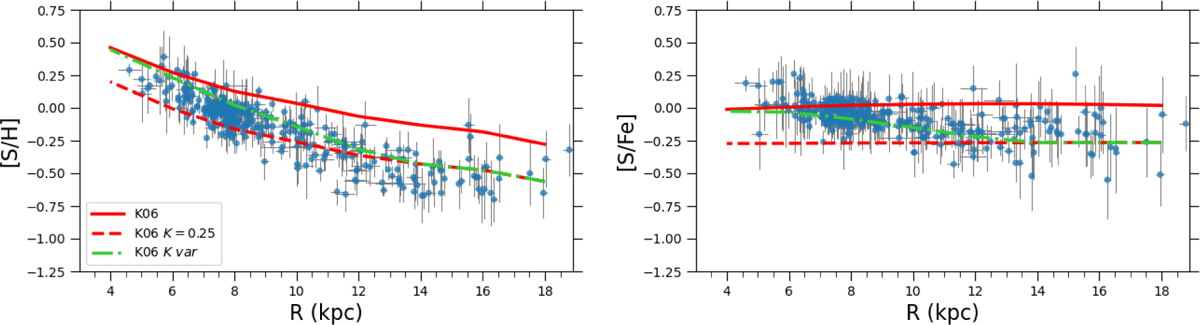
Effect of the S yield for massive stars on the [S/H] and [S/Fe] radial gradients for the model with a flattened star formation efficiency profile for the outer regions. The solid red line shows the model with standard yield prescriptions (from Kobayashi et al. 2006, 2011), the dashed red line shows the model with the S yield reduced by a factor 4, and the dash-dotted green line displays a model with scaling factor for the S yields that is variable with radius. The symbols are the same as in Fig. 8.
Current usage metrics show cumulative count of Article Views (full-text article views including HTML views, PDF and ePub downloads, according to the available data) and Abstracts Views on Vision4Press platform.
Data correspond to usage on the plateform after 2015. The current usage metrics is available 48-96 hours after online publication and is updated daily on week days.
Initial download of the metrics may take a while.