Fig. 6
Download original image
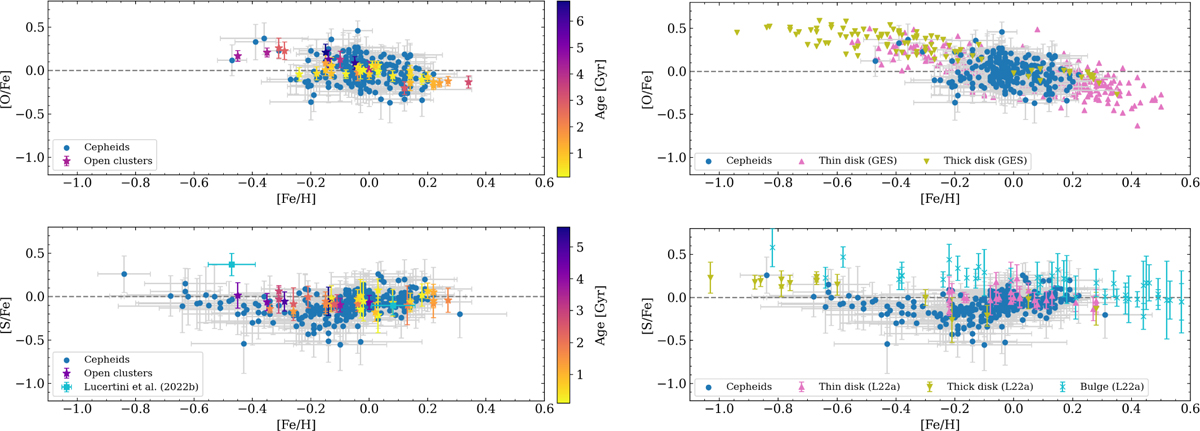
Abundance ratios as a function of the iron abundance. Left panels: same data as in Fig. 2, but comparing the [O/Fe] (top) and [S/Fe] (bottom) ratios for our samples of classical Cepheids and open clusters. The bottom panel also shows the abundance ratios for the open clusters (Trumpler 5 and Trumpler 20) provided by Lucertini et al. (2023). Right panels: [O/Fe] and [S/Fe] ratios for Galactic Cepheids compared with thin-and thick-disk stars provided by the GES (DR5.0) collaboration and with thin-disk, thick-disk, and bulge field stars provided by Lucertini et al. (2022, L22a).
Current usage metrics show cumulative count of Article Views (full-text article views including HTML views, PDF and ePub downloads, according to the available data) and Abstracts Views on Vision4Press platform.
Data correspond to usage on the plateform after 2015. The current usage metrics is available 48-96 hours after online publication and is updated daily on week days.
Initial download of the metrics may take a while.