Open Access
Fig. 3
Download original image
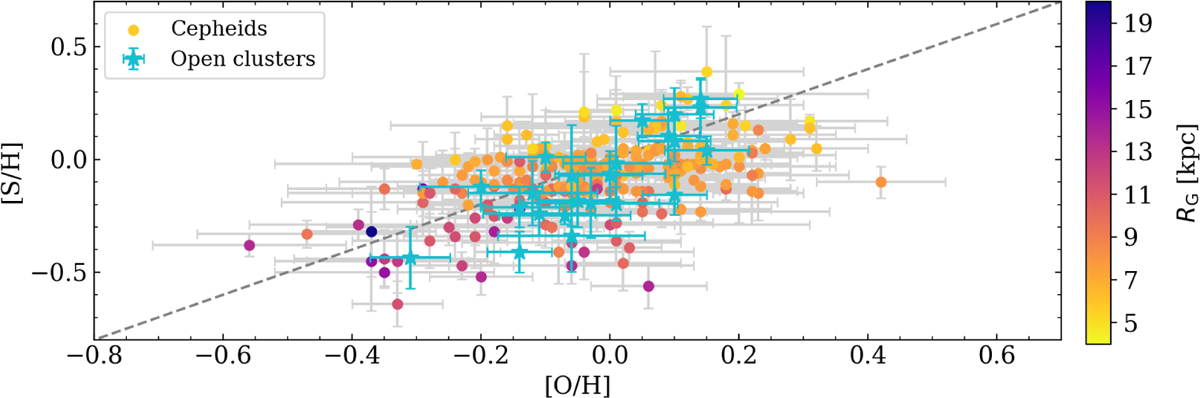
[S/H] as a function of the [O/H] abundances. Our sample of Cepheids, color-coded according to the distance from the Galactic center (see the color bar on the right side), is compared with the same open clusters as plotted in Fig. 2. The dashed gray line is the 1:1 linear relation.
Current usage metrics show cumulative count of Article Views (full-text article views including HTML views, PDF and ePub downloads, according to the available data) and Abstracts Views on Vision4Press platform.
Data correspond to usage on the plateform after 2015. The current usage metrics is available 48-96 hours after online publication and is updated daily on week days.
Initial download of the metrics may take a while.