Open Access
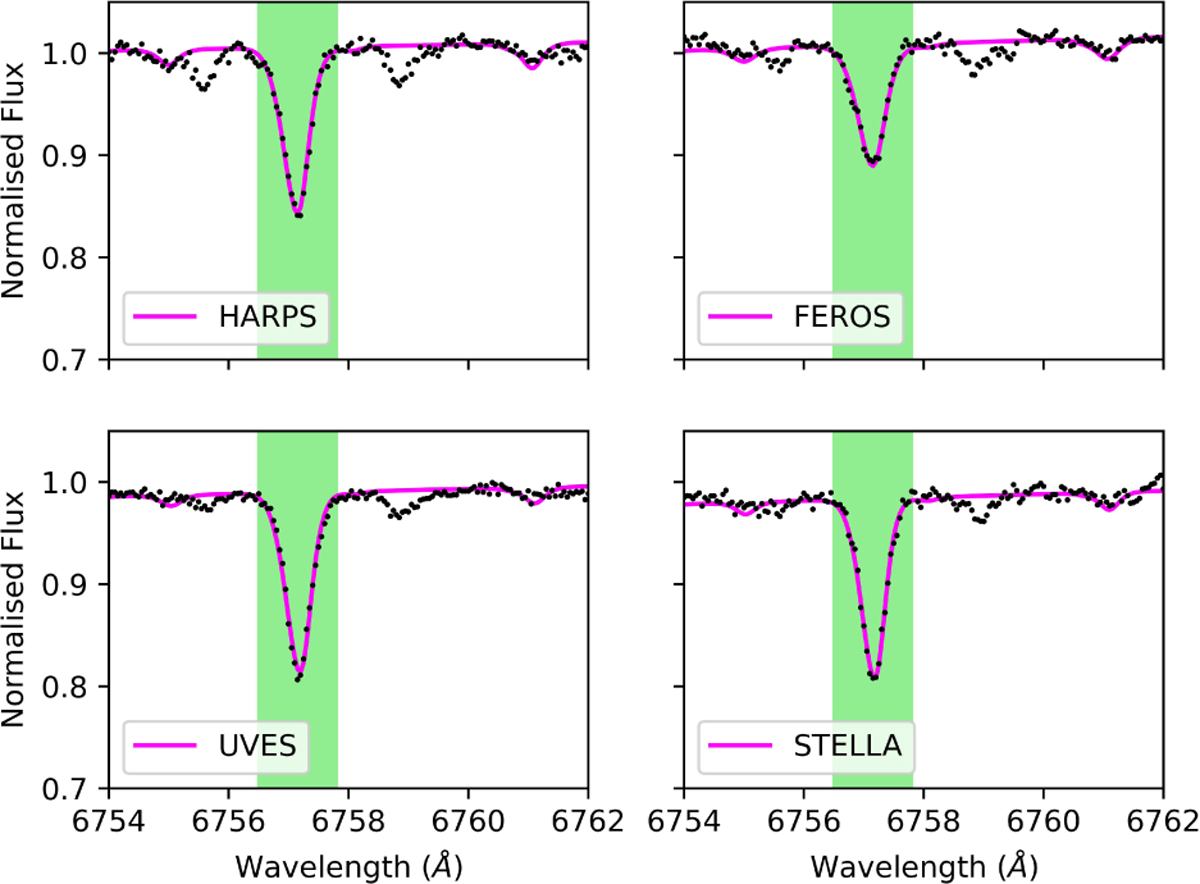
Fig. B.1
Download original image
Examples of spectral synthesis for the S I line at 6757 A. The observed (HARPS, FEROS, UVES, and STELLA) and best-fit synthetic spectra are plotted as black points and magenta solid lines, respectively. The line of interest is marked as the green area.
Current usage metrics show cumulative count of Article Views (full-text article views including HTML views, PDF and ePub downloads, according to the available data) and Abstracts Views on Vision4Press platform.
Data correspond to usage on the plateform after 2015. The current usage metrics is available 48-96 hours after online publication and is updated daily on week days.
Initial download of the metrics may take a while.