Fig. 8.
Download original image
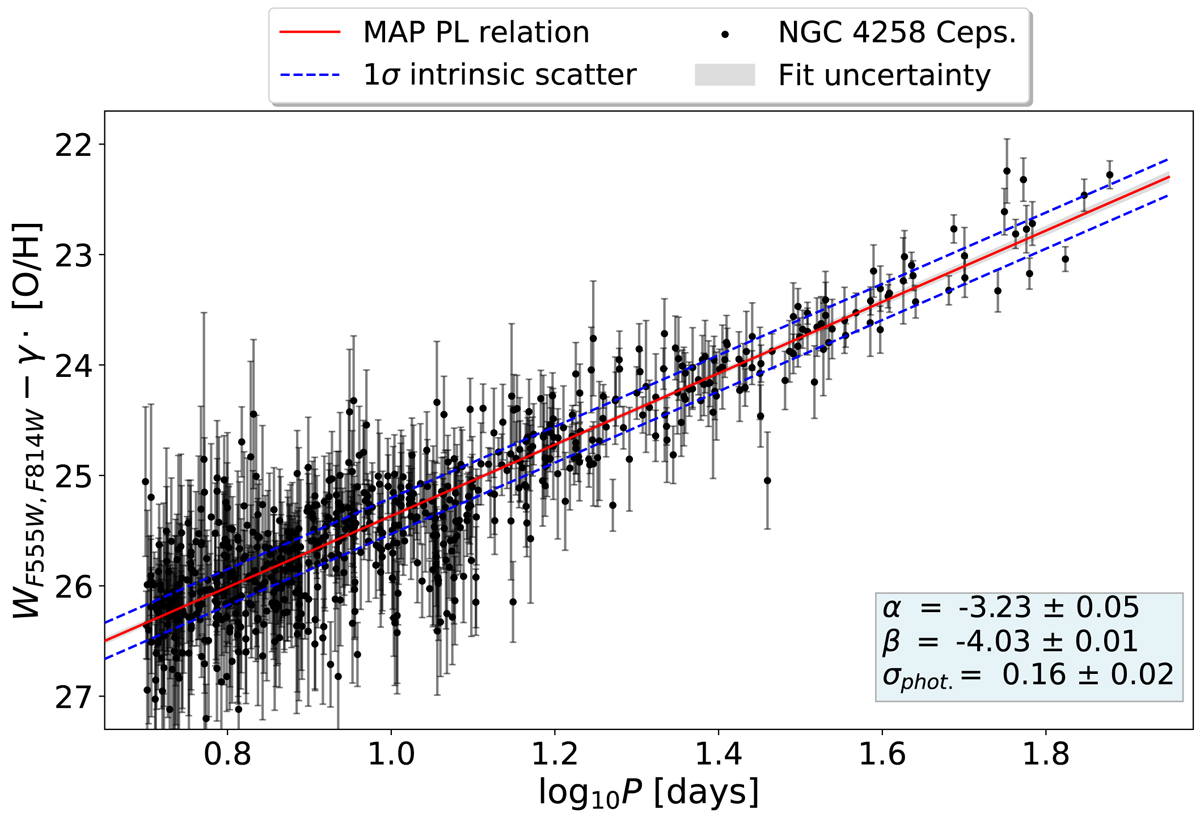
Period-luminosity relation fit to the NGC 4258 anchor data. The red line shows the MAP fit, while the dashed lines denote the range of intrinsic scatter, which is due to observational constraints and the finite width of the instability strip. For simplicity and to reduce scatter, we marginalised over the metallicity values for this plot.
Current usage metrics show cumulative count of Article Views (full-text article views including HTML views, PDF and ePub downloads, according to the available data) and Abstracts Views on Vision4Press platform.
Data correspond to usage on the plateform after 2015. The current usage metrics is available 48-96 hours after online publication and is updated daily on week days.
Initial download of the metrics may take a while.