Fig. 4.
Download original image
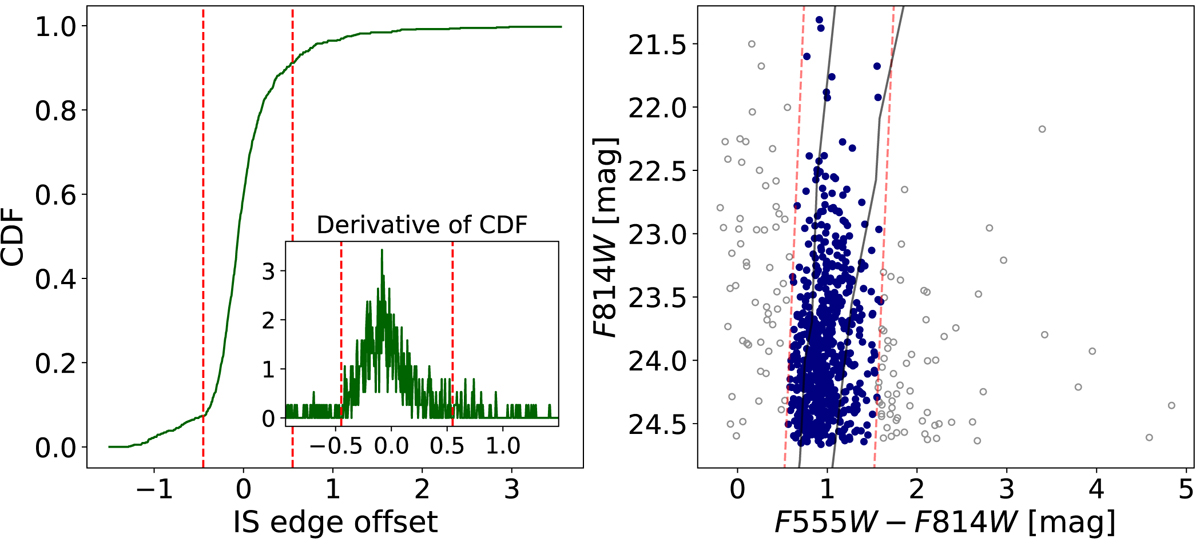
Filtering of the sample stars based on the CMD. Left: CDF of the CMD parametrised by the offset of the adopted IS slope. The inset shows the derivative of the CDF in the range of interest. The dashed red lines show the limits at which the CDF values start to either increase significantly or level off, i.e. the positions of the edges of the M 51 IS. Right: CMD of the M 51 sample, with the IS edge derived based on the CDF (red line). The grey points show the stars that were flagged as outliers. The grey curves show the theoretical instability strip edges from Anderson et al. (2016) reddened by the Galactic colour excess of 0.03 mag for comparison.
Current usage metrics show cumulative count of Article Views (full-text article views including HTML views, PDF and ePub downloads, according to the available data) and Abstracts Views on Vision4Press platform.
Data correspond to usage on the plateform after 2015. The current usage metrics is available 48-96 hours after online publication and is updated daily on week days.
Initial download of the metrics may take a while.