Fig. 2.
Download original image
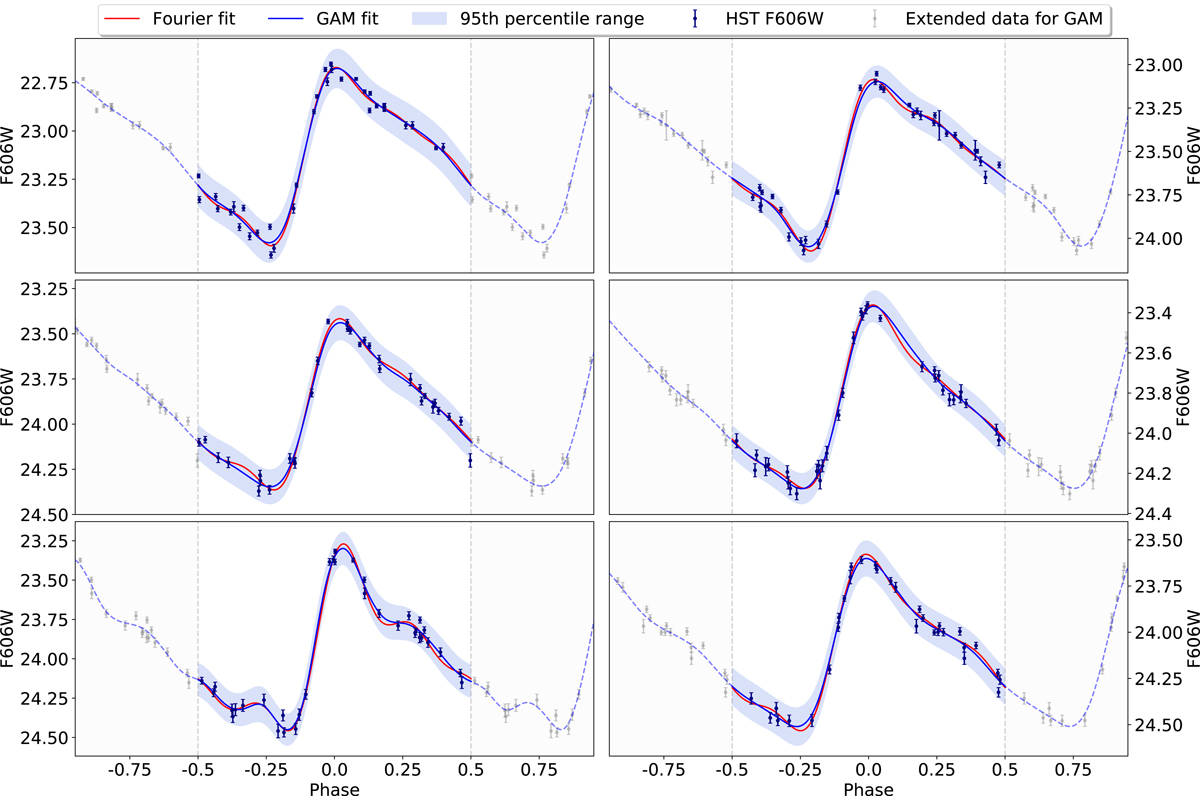
Example of GAM and Fourier fits for a handful M 51 Cepheids. The blue shaded region shows the 95th percentile range of the GAM fits. The plots show that the two models agree perfectly within these uncertainty limits. The grey shaded region shows the extension region for the GAM fitting, which was used to enhance the stability of the phase curve fits towards the edges of the region of interest (close to the phases −0.5 and 0.5).
Current usage metrics show cumulative count of Article Views (full-text article views including HTML views, PDF and ePub downloads, according to the available data) and Abstracts Views on Vision4Press platform.
Data correspond to usage on the plateform after 2015. The current usage metrics is available 48-96 hours after online publication and is updated daily on week days.
Initial download of the metrics may take a while.