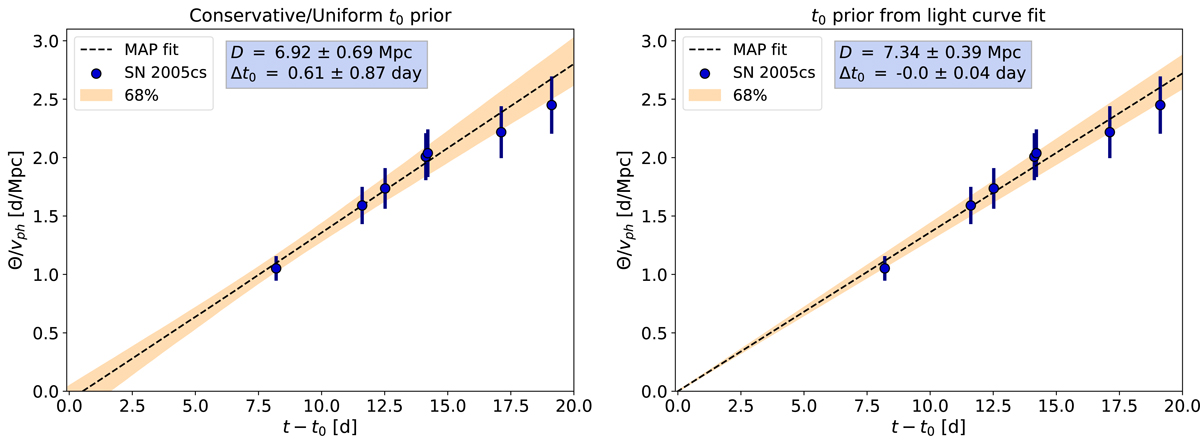
Fig. 14.
Download original image
EPM regression obtained for SN 2005cs in the two versions (the left plot shows the more conservative approach, where we adopted a flat prior for t0, and the right plot shows the fit for the t0 prior that is informed by the light curve). The x-axis shows the time elapsed since the explosion epoch t0, MJD 53548.73, for both plots. The points show the evolution of Θ/vph for this supernova as inferred from spectral fitting. The shaded region shows the uncertainty of the fit.
Current usage metrics show cumulative count of Article Views (full-text article views including HTML views, PDF and ePub downloads, according to the available data) and Abstracts Views on Vision4Press platform.
Data correspond to usage on the plateform after 2015. The current usage metrics is available 48-96 hours after online publication and is updated daily on week days.
Initial download of the metrics may take a while.