Fig. 13.
Download original image
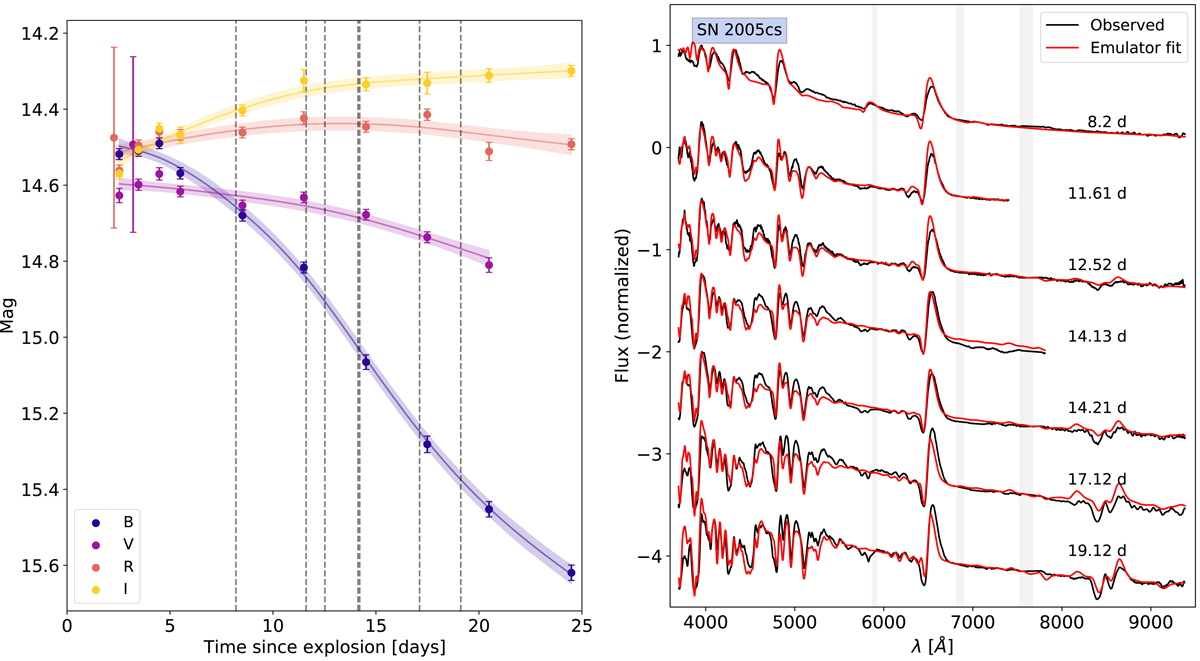
Results of modelling the photometric and spectral time series of SN 2005cs. Left: Gaussian process light-curve fits for 2005cs in the various bands. The dashed grey lines denote the epochs at which a spectrum was taken that was included in our sample. The epochs were measured with respect to MJD 53548.73. Right: the spectra and their emulator fits for the various epochs for an assumed reddening of E(B − V) = 0.03 mag. The grey bands indicate the telluric regions and the sodium band that were masked for the fitting.
Current usage metrics show cumulative count of Article Views (full-text article views including HTML views, PDF and ePub downloads, according to the available data) and Abstracts Views on Vision4Press platform.
Data correspond to usage on the plateform after 2015. The current usage metrics is available 48-96 hours after online publication and is updated daily on week days.
Initial download of the metrics may take a while.