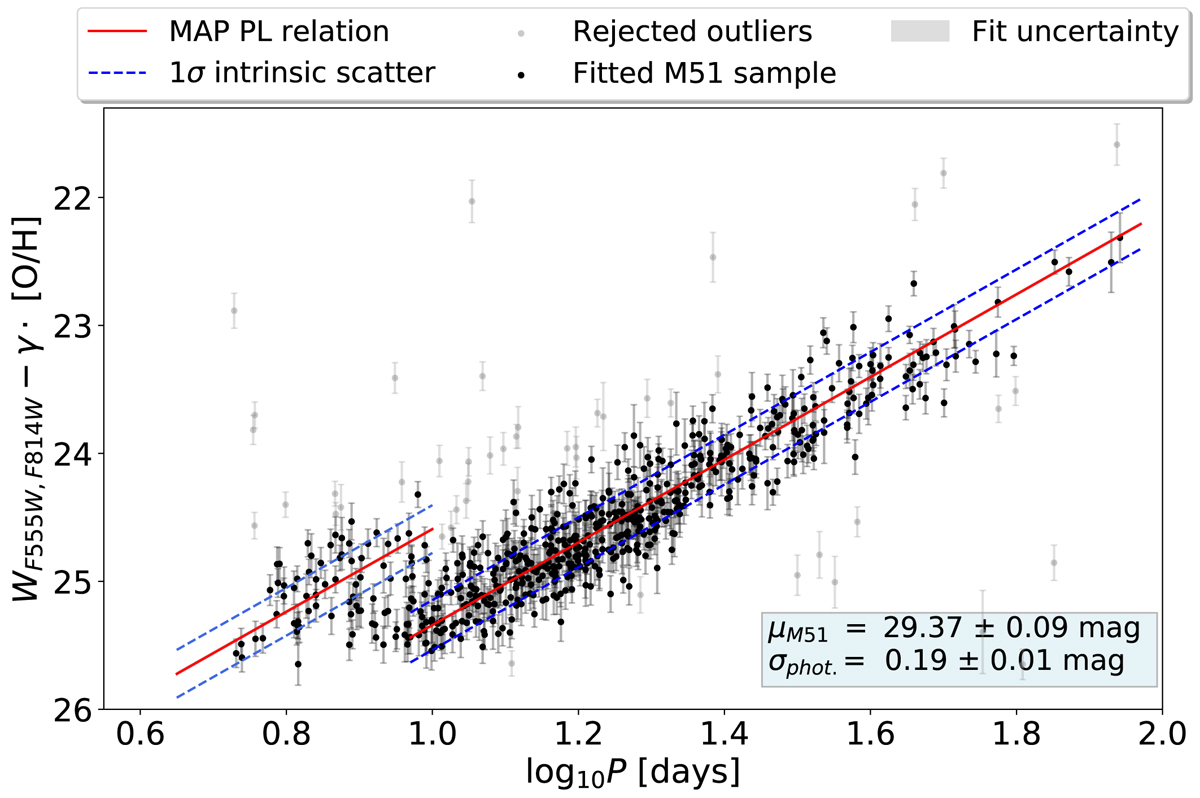
Fig. 10.
Download original image
Simultaneous fitting of the fundamental mode and overtone PL relation for the M 51 Cepheid sample. For this run, an offset of 0.75 magnitudes was assumed between the two modes. The red line corresponds to the MAP estimate. The light grey points denote the data points that were rejected by the outlier detection method, and the solid points show the points that were used to fit the relation. As before, the displayed distance uncertainty includes the aforementioned systematic terms.
Current usage metrics show cumulative count of Article Views (full-text article views including HTML views, PDF and ePub downloads, according to the available data) and Abstracts Views on Vision4Press platform.
Data correspond to usage on the plateform after 2015. The current usage metrics is available 48-96 hours after online publication and is updated daily on week days.
Initial download of the metrics may take a while.