Fig. 1.
Download original image
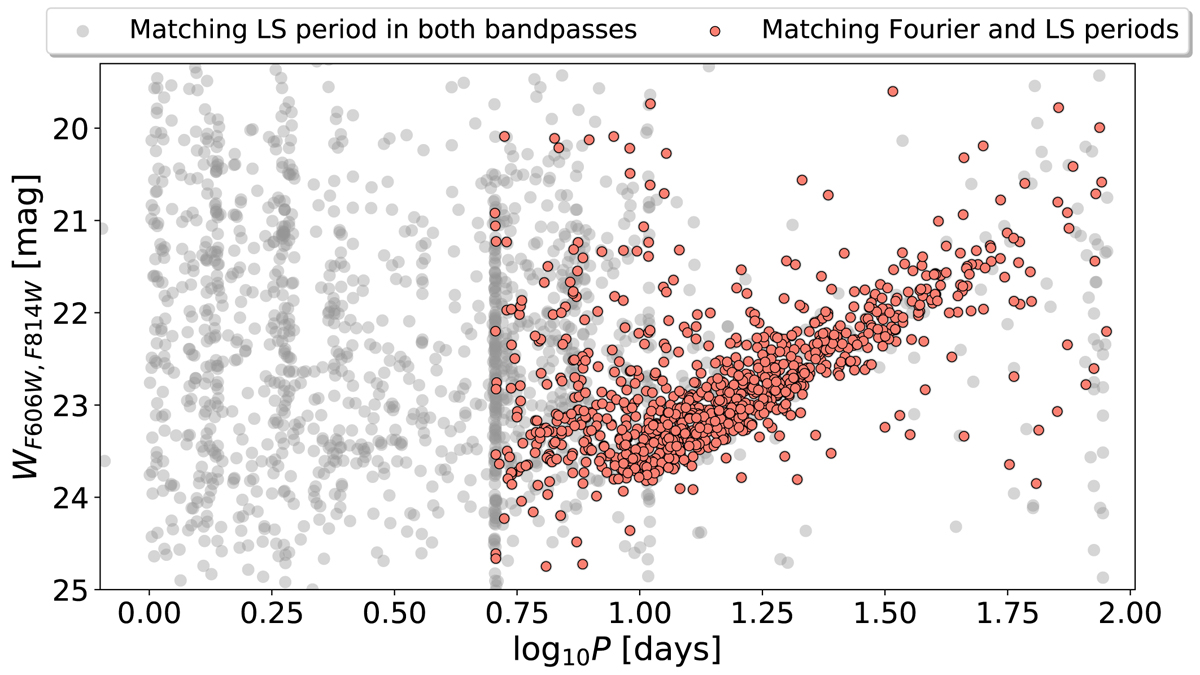
Catalogue PL relation after the filtering based on the Lomb–Scargle (LS) and Fourier periods and the Nyquist frequency. The Wesenheit indices were calculated based on the catalogue magnitudes. The grey dots show the stars for which the LS period matched in the F606W and F814W bands, and the red dots show the stars for which the LS and Fourier periods matched for all filters.
Current usage metrics show cumulative count of Article Views (full-text article views including HTML views, PDF and ePub downloads, according to the available data) and Abstracts Views on Vision4Press platform.
Data correspond to usage on the plateform after 2015. The current usage metrics is available 48-96 hours after online publication and is updated daily on week days.
Initial download of the metrics may take a while.